- Page 1 and 2:
PV*SOL Expert 5.5 - Manual PV*SOL
- Page 3 and 4:
1 Program Series PV*SOL The PV*SOL
- Page 5 and 6:
• New climate data from DWD (mete
- Page 7 and 8:
3.2 Activation of the Programme Men
- Page 9 and 10:
3.2.3 Request the Key Code Menu Hel
- Page 11 and 12:
3.3 Licensing Provisions Menu Help
- Page 13:
3.3.2 Maintenance agreement To make
- Page 16 and 17:
4.1 Radiation Processor In the supp
- Page 18 and 19:
PV*SOL Expert 6.0 - Manual Image 3
- Page 20 and 21:
4.4 Temperature Model The temperatu
- Page 22 and 23:
4.4.2 Dynamic temperature model Sol
- Page 24 and 25:
4.5 Cabling Losses In order to calc
- Page 26 and 27:
4.7 Economic Efficiency Calculation
- Page 28 and 29:
5 PV*SOL® Components The PV*SOL ®
- Page 30 and 31:
6.1 User Interface (Menu, Tool Bar,
- Page 32 and 33:
PV*SOL Expert 6.0 - Manual 30 3D vi
- Page 34 and 35:
PV*SOL Expert 6.0 - Manual 32 then
- Page 36 and 37:
PV*SOL Expert 6.0 - Manual The load
- Page 38 and 39:
7 File Menu Here you will find all
- Page 40 and 41:
7.2 Quick design The quick design i
- Page 42 and 43:
7.2.2 Quick design of grid-connecte
- Page 44 and 45:
7.3 Project Administration... In Pr
- Page 46 and 47:
7.5 Save or Save As... File/Save sa
- Page 48 and 49:
8 Conditions Menu Before a simulati
- Page 50 and 51:
8.2 Pollutant Mix Pollutant Emissio
- Page 52 and 53:
9 Appliances Menu -> Prerequisite:
- Page 54 and 55:
9.2 Load Profile - Appliances via L
- Page 56 and 57:
9.2.1 Holiday Periods Page Consumpt
- Page 58 and 59:
9.4 Define an Appliance Page Consum
- Page 60 and 61:
PV*SOL Expert 6.0 - Manual 58 6. Cl
- Page 62 and 63:
9.4.2 Individual Appliances: User-D
- Page 64 and 65:
9.4.4 Individual Appliances: Short-
- Page 66 and 67:
10.1 Technical Data System > Techni
- Page 68 and 69:
10.1.2 Technical data, stand-alone
- Page 70 and 71:
10.1.2.2 PV array, stand-alone Syst
- Page 72 and 73:
10.1.2.4 Battery (stand-alone) Syst
- Page 74 and 75:
10.1.2.6 Back-up generator (stand-a
- Page 76 and 77:
10.1.3.1 System Inverter System > T
- Page 78 and 79:
PV*SOL Expert 6.0 - Manual 76 8. a)
- Page 80 and 81:
10.1.3.4 Losses through Feed-in Man
- Page 82 and 83:
PV*SOL Expert 6.0 - Manual 80
- Page 84 and 85:
10.1.6 Roof Parameters System (2d)
- Page 86 and 87:
10.1.6.2 Tree view System (2d) > Te
- Page 88 and 89:
PV*SOL Expert 6.0 - Manual 86 2. Cl
- Page 90 and 91:
10.1.6.5 Input Field The appearance
- Page 92 and 93:
10.1.6.6 Border Distances System (2
- Page 94 and 95:
10.1.6.7.1 New Roof Area System (2D
- Page 96 and 97:
10.1.6.7.3 New PV Area System (2D)
- Page 98 and 99:
10.1.6.8.1 Calculate the Optimum Ro
- Page 100 and 101:
10.1.6.9 Workflow Example for a PV
- Page 102 and 103: 10.1.7 Orientation System > Technic
- Page 104 and 105: 10.1.8 Losses 10.1.8.1 Losses at th
- Page 106 and 107: 10.1.8.2 Losses through Feed-in Man
- Page 108 and 109: PV*SOL Expert 6.0 - Manual If the P
- Page 110 and 111: PV*SOL Expert 6.0 - Manual Stand-Al
- Page 112 and 113: 10.1.10 System Diagram System > Tec
- Page 114 and 115: PV*SOL Expert 6.0 - Manual b) or by
- Page 116 and 117: 11 Calculations Menu If the system
- Page 118 and 119: 11.2 Simulation Starts simulation o
- Page 120 and 121: 11.3.1 Economic Efficiency: Grid Co
- Page 122 and 123: PV*SOL Expert 6.0 - Manual 120 3. S
- Page 124 and 125: 11.3.1.2.1 Define Output Losses Cal
- Page 126 and 127: 11.3.1.3.1 Investment Costs Click o
- Page 128 and 129: 11.3.1.3.3 Other Costs On this page
- Page 130 and 131: 11.3.1.3.5 Consumption Costs Here y
- Page 132 and 133: 11.3.1.4 Financing Number of Loans
- Page 134 and 135: 11.3.1.5 Tax In order for tax payme
- Page 136 and 137: 11.3.1.6.1 Graphics You are able to
- Page 138 and 139: 11.3.1.6.3 Report Here you are able
- Page 140 and 141: 11.3.2.1 Basic Parameters The follo
- Page 142 and 143: 11.3.2.3 Back-up Generator If a bac
- Page 144 and 145: 11.3.3 Results Overview The followi
- Page 146 and 147: 12 Results Menu With PV*SOL ® you
- Page 148 and 149: 12.2 Energy and Climate Data Presen
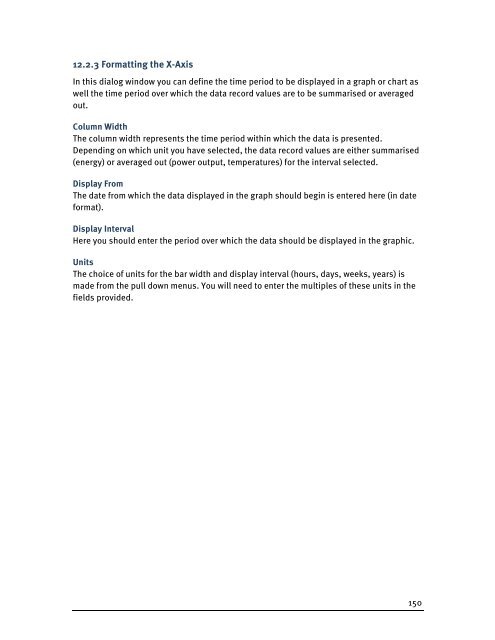
- Page 150 and 151: PV*SOL Expert 6.0 - Manual 148 Chan
- Page 154 and 155: 12.2.5 Printing Graphics The usual
- Page 156 and 157: 12.3 Income from Export to Utility
- Page 158 and 159: PV*SOL Expert 6.0 - Manual -> See a
- Page 160 and 161: 12.6 Project Report The results of
- Page 162 and 163: 12.6.2 Detailed Project Report The
- Page 164 and 165: 12.6.4 Print dialog The standard pr
- Page 166 and 167: 12.7.1 Variant Comparison The proje
- Page 168 and 169: PV*SOL Expert 6.0 - Manual 166 3. O
- Page 170 and 171: PV*SOL Expert 6.0 - Manual No-Load
- Page 172 and 173: 13.2.2 Module Part Load Operation T
- Page 174 and 175: PV*SOL Expert 6.0 - Manual The inpu
- Page 176 and 177: 13.2.4 Inverter - Stand-Alone Syste
- Page 178 and 179: 13.2.6 Battery (not available with
- Page 180 and 181: 13.2.7.1 Tariff Time Periods The hi
- Page 182 and 183: PV*SOL Expert 6.0 - Manual On makin
- Page 184 and 185: PV*SOL Expert 6.0 - Manual Output p
- Page 186 and 187: 13.2.7.3.1 Load Price This dialog i
- Page 188 and 189: 13.2.7.3.2 Heavy Load Periods The h
- Page 190 and 191: 13.2.7.4.1 Discounts General Discou
- Page 192 and 193: 13.2.7.4.2 Load Utilisation Period
- Page 194 and 195: 13.2.8 Feed-in Tariff Unlike the ot
- Page 196 and 197: 13.2.9 Pollutants You can define a
- Page 198 and 199: 13.2.11 Loans From here you can ent
- Page 200 and 201: 14.1 Paths... You are able to defin
- Page 202 and 203:
PV*SOL Expert 6.0 - Manual Update C
- Page 204 and 205:
14.2.2 Database Monitoring System W
- Page 206 and 207:
16 Help Menu Menu Help Contents ope
- Page 208 and 209:
PV*SOL Expert 6.0 - Manual Battery
- Page 210 and 211:
PV*SOL Expert 6.0 - Manual Own Cons
- Page 212 and 213:
PV*SOL Expert 6.0 - Manual Specific
- Page 214 and 215:
Inverter ..........................
- Page 216:
215


