Docetaxel with prednisone or prednisolone for the treatment of ...
Docetaxel with prednisone or prednisolone for the treatment of ...
Docetaxel with prednisone or prednisolone for the treatment of ...
Create successful ePaper yourself
Turn your PDF publications into a flip-book with our unique Google optimized e-Paper software.
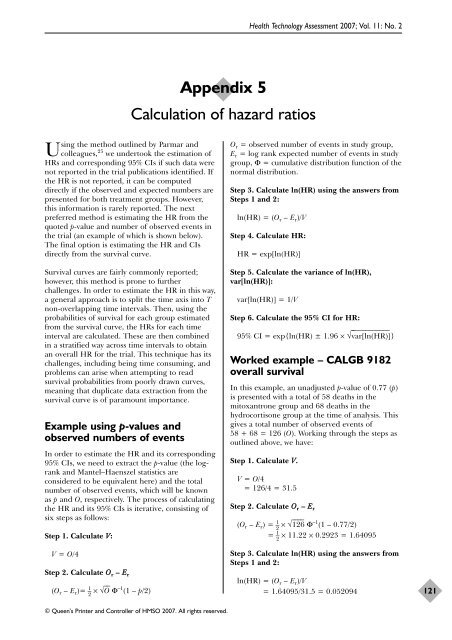
Using <strong>the</strong> method outlined by Parmar and<br />
colleagues, 25 we undertook <strong>the</strong> estimation <strong>of</strong><br />
HRs and c<strong>or</strong>responding 95% CIs if such data were<br />
not rep<strong>or</strong>ted in <strong>the</strong> trial publications identified. If<br />
<strong>the</strong> HR is not rep<strong>or</strong>ted, it can be computed<br />
directly if <strong>the</strong> observed and expected numbers are<br />
presented f<strong>or</strong> both <strong>treatment</strong> groups. However,<br />
this inf<strong>or</strong>mation is rarely rep<strong>or</strong>ted. The next<br />
preferred method is estimating <strong>the</strong> HR from <strong>the</strong><br />
quoted p-value and number <strong>of</strong> observed events in<br />
<strong>the</strong> trial (an example <strong>of</strong> which is shown below).<br />
The final option is estimating <strong>the</strong> HR and CIs<br />
directly from <strong>the</strong> survival curve.<br />
Survival curves are fairly commonly rep<strong>or</strong>ted;<br />
however, this method is prone to fur<strong>the</strong>r<br />
challenges. In <strong>or</strong>der to estimate <strong>the</strong> HR in this way,<br />
a general approach is to split <strong>the</strong> time axis into T<br />
non-overlapping time intervals. Then, using <strong>the</strong><br />
probabilities <strong>of</strong> survival f<strong>or</strong> each group estimated<br />
from <strong>the</strong> survival curve, <strong>the</strong> HRs f<strong>or</strong> each time<br />
interval are calculated. These are <strong>the</strong>n combined<br />
in a stratified way across time intervals to obtain<br />
an overall HR f<strong>or</strong> <strong>the</strong> trial. This technique has its<br />
challenges, including being time consuming, and<br />
problems can arise when attempting to read<br />
survival probabilities from po<strong>or</strong>ly drawn curves,<br />
meaning that duplicate data extraction from <strong>the</strong><br />
survival curve is <strong>of</strong> paramount imp<strong>or</strong>tance.<br />
Example using p-values and<br />
observed numbers <strong>of</strong> events<br />
In <strong>or</strong>der to estimate <strong>the</strong> HR and its c<strong>or</strong>responding<br />
95% CIs, we need to extract <strong>the</strong> p-value (<strong>the</strong> logrank<br />
and Mantel–Haenszel statistics are<br />
considered to be equivalent here) and <strong>the</strong> total<br />
number <strong>of</strong> observed events, which will be known<br />
as p and O, respectively. The process <strong>of</strong> calculating<br />
<strong>the</strong> HR and its 95% CIs is iterative, consisting <strong>of</strong><br />
six steps as follows:<br />
Step 1. Calculate V:<br />
V = O/4<br />
Step 2. Calculate O r – E r<br />
(O r – E r)= 1 – 2 × √ –– O Φ –1 (1 – p/2)<br />
Appendix 5<br />
Calculation <strong>of</strong> hazard ratios<br />
© Queen’s Printer and Controller <strong>of</strong> HMSO 2007. All rights reserved.<br />
Health Technology Assessment 2007; Vol. 11: No. 2<br />
O r = observed number <strong>of</strong> events in study group,<br />
E r = log rank expected number <strong>of</strong> events in study<br />
group, Φ = cumulative distribution function <strong>of</strong> <strong>the</strong><br />
n<strong>or</strong>mal distribution.<br />
Step 3. Calculate ln(HR) using <strong>the</strong> answers from<br />
Steps 1 and 2:<br />
ln(HR) = (O r – E r)/V<br />
Step 4. Calculate HR:<br />
HR = exp[ln(HR)]<br />
Step 5. Calculate <strong>the</strong> variance <strong>of</strong> ln(HR),<br />
var[ln(HR)]:<br />
var[ln(HR)] = 1/V<br />
Step 6. Calculate <strong>the</strong> 95% CI f<strong>or</strong> HR:<br />
95% CI = exp{ln(HR) ± 1.96 × √ –––––––––––<br />
var[ln(HR)]}<br />
W<strong>or</strong>ked example – CALGB 9182<br />
overall survival<br />
In this example, an unadjusted p-value <strong>of</strong> 0.77 (p)<br />
is presented <strong>with</strong> a total <strong>of</strong> 58 deaths in <strong>the</strong><br />
mitoxantrone group and 68 deaths in <strong>the</strong><br />
hydroc<strong>or</strong>tisone group at <strong>the</strong> time <strong>of</strong> analysis. This<br />
gives a total number <strong>of</strong> observed events <strong>of</strong><br />
58 + 68 = 126 (O). W<strong>or</strong>king through <strong>the</strong> steps as<br />
outlined above, we have:<br />
Step 1. Calculate V.<br />
V = O/4<br />
V = 126/4 = 31.5<br />
Step 2. Calculate O r – E r<br />
(O r – E r) = 1 – 2 × √ ––––<br />
126 Φ –1 (1 – 0.77/2)<br />
= 1 – 2 × 11.22 × 0.2923 = 1.64095<br />
Step 3. Calculate ln(HR) using <strong>the</strong> answers from<br />
Steps 1 and 2:<br />
ln(HR) = (O r – E r)/V<br />
ln(HR) = 1.64095/31.5 = 0.052094<br />
121


