

Docetaxel with prednisone or prednisolone for the treatment of ...
Docetaxel with prednisone or prednisolone for the treatment of ...
Docetaxel with prednisone or prednisolone for the treatment of ...

Create successful ePaper yourself
Turn your PDF publications into a flip-book with our unique Google optimized e-Paper software.
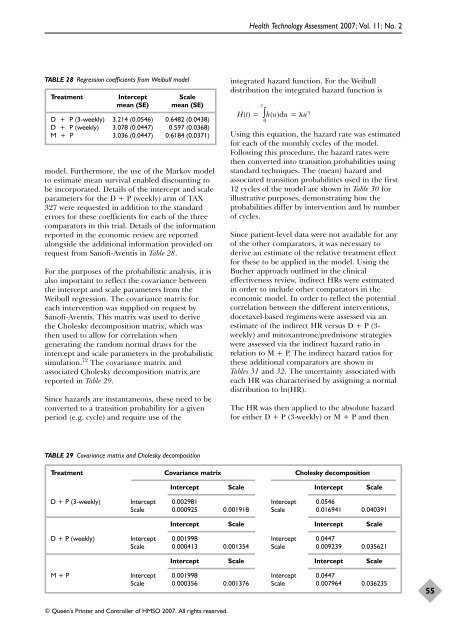
TABLE 28 Regression coefficients from Weibull model<br />
Treatment Intercept Scale<br />
mean (SE) mean (SE)<br />
D + P (3-weekly) 3.214 (0.0546) 0.6482 (0.0438)<br />
D + P (weekly) 3.078 (0.0447) 0.597 (0.0368)<br />
M + P 3.036 (0.0447) 0.6184 (0.0371)<br />
model. Fur<strong>the</strong>rm<strong>or</strong>e, <strong>the</strong> use <strong>of</strong> <strong>the</strong> Markov model<br />
to estimate mean survival enabled discounting to<br />
be inc<strong>or</strong>p<strong>or</strong>ated. Details <strong>of</strong> <strong>the</strong> intercept and scale<br />
parameters f<strong>or</strong> <strong>the</strong> D + P (weekly) arm <strong>of</strong> TAX<br />
327 were requested in addition to <strong>the</strong> standard<br />
err<strong>or</strong>s f<strong>or</strong> <strong>the</strong>se coefficients f<strong>or</strong> each <strong>of</strong> <strong>the</strong> three<br />
comparat<strong>or</strong>s in this trial. Details <strong>of</strong> <strong>the</strong> inf<strong>or</strong>mation<br />
rep<strong>or</strong>ted in <strong>the</strong> economic review are rep<strong>or</strong>ted<br />
alongside <strong>the</strong> additional inf<strong>or</strong>mation provided on<br />
request from San<strong>of</strong>i-Aventis in Table 28.<br />
F<strong>or</strong> <strong>the</strong> purposes <strong>of</strong> <strong>the</strong> probabilistic analysis, it is<br />
also imp<strong>or</strong>tant to reflect <strong>the</strong> covariance between<br />
<strong>the</strong> intercept and scale parameters from <strong>the</strong><br />
Weibull regression. The covariance matrix f<strong>or</strong><br />
each intervention was supplied on request by<br />
San<strong>of</strong>i-Aventis. This matrix was used to derive<br />
<strong>the</strong> Cholesky decomposition matrix, which was<br />
<strong>the</strong>n used to allow f<strong>or</strong> c<strong>or</strong>relation when<br />
generating <strong>the</strong> random n<strong>or</strong>mal draws f<strong>or</strong> <strong>the</strong><br />
intercept and scale parameters in <strong>the</strong> probabilistic<br />
simulation. 72 The covariance matrix and<br />
associated Cholesky decomposition matrix are<br />
rep<strong>or</strong>ted in Table 29.<br />
Since hazards are instantaneous, <strong>the</strong>se need to be<br />
converted to a transition probability f<strong>or</strong> a given<br />
period (e.g. cycle) and require use <strong>of</strong> <strong>the</strong><br />
TABLE 29 Covariance matrix and Cholesky decomposition<br />
© Queen’s Printer and Controller <strong>of</strong> HMSO 2007. All rights reserved.<br />
integrated hazard function. F<strong>or</strong> <strong>the</strong> Weibull<br />
distribution <strong>the</strong> integrated hazard function is<br />
H(t) =<br />
Health Technology Assessment 2007; Vol. 11: No. 2<br />
t<br />
∫ 0 h(u)du = u <br />
Using this equation, <strong>the</strong> hazard rate was estimated<br />
f<strong>or</strong> each <strong>of</strong> <strong>the</strong> monthly cycles <strong>of</strong> <strong>the</strong> model.<br />
Following this procedure, <strong>the</strong> hazard rates were<br />
<strong>the</strong>n converted into transition probabilities using<br />
standard techniques. The (mean) hazard and<br />
associated transition probabilities used in <strong>the</strong> first<br />
12 cycles <strong>of</strong> <strong>the</strong> model are shown in Table 30 f<strong>or</strong><br />
illustrative purposes, demonstrating how <strong>the</strong><br />
probabilities differ by intervention and by number<br />
<strong>of</strong> cycles.<br />
Since patient-level data were not available f<strong>or</strong> any<br />
<strong>of</strong> <strong>the</strong> o<strong>the</strong>r comparat<strong>or</strong>s, it was necessary to<br />
derive an estimate <strong>of</strong> <strong>the</strong> relative <strong>treatment</strong> effect<br />
f<strong>or</strong> <strong>the</strong>se to be applied in <strong>the</strong> model. Using <strong>the</strong><br />
Bucher approach outlined in <strong>the</strong> clinical<br />
effectiveness review, indirect HRs were estimated<br />
in <strong>or</strong>der to include o<strong>the</strong>r comparat<strong>or</strong>s in <strong>the</strong><br />
economic model. In <strong>or</strong>der to reflect <strong>the</strong> potential<br />
c<strong>or</strong>relation between <strong>the</strong> different interventions,<br />
docetaxel-based regimens were assessed via an<br />
estimate <strong>of</strong> <strong>the</strong> indirect HR versus D + P (3weekly)<br />
and mitoxantrone/<strong>prednisone</strong> strategies<br />
were assessed via <strong>the</strong> indirect hazard ratio in<br />
relation to M + P. The indirect hazard ratios f<strong>or</strong><br />
<strong>the</strong>se additional comparat<strong>or</strong>s are shown in<br />
Tables 31 and 32. The uncertainty associated <strong>with</strong><br />
each HR was characterised by assigning a n<strong>or</strong>mal<br />
distribution to ln(HR).<br />
The HR was <strong>the</strong>n applied to <strong>the</strong> absolute hazard<br />
f<strong>or</strong> ei<strong>the</strong>r D + P (3-weekly) <strong>or</strong> M + P and <strong>the</strong>n<br />
Treatment Covariance matrix Cholesky decomposition<br />
Intercept Scale Intercept Scale<br />
D + P (3-weekly) Intercept 0.002981 Intercept 0.0546<br />
Scale 0.000925 0.001918 Scale 0.016941 0.040391<br />
Intercept Scale Intercept Scale<br />
D + P (weekly) Intercept 0.001998 Intercept 0.0447<br />
Scale 0.000413 0.001354 Scale 0.009239 0.035621<br />
Intercept Scale Intercept Scale<br />
M + P Intercept 0.001998 Intercept 0.0447<br />
Scale 0.000356 0.001376 Scale 0.007964 0.036235<br />
55


