

Docetaxel with prednisone or prednisolone for the treatment of ...
Docetaxel with prednisone or prednisolone for the treatment of ...
Docetaxel with prednisone or prednisolone for the treatment of ...

You also want an ePaper? Increase the reach of your titles
YUMPU automatically turns print PDFs into web optimized ePapers that Google loves.
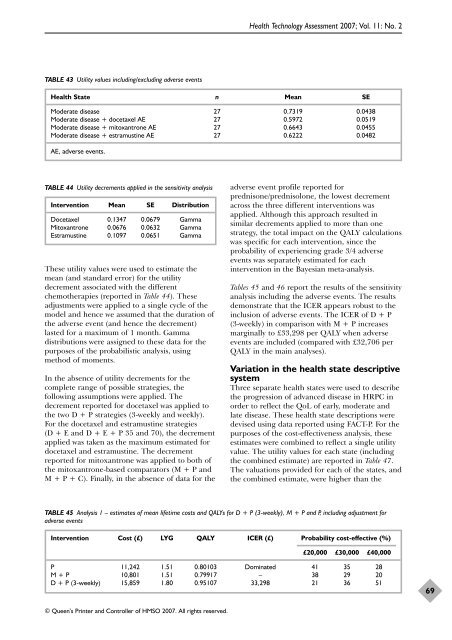
TABLE 43 Utility values including/excluding adverse events<br />
These utility values were used to estimate <strong>the</strong><br />
mean (and standard err<strong>or</strong>) f<strong>or</strong> <strong>the</strong> utility<br />
decrement associated <strong>with</strong> <strong>the</strong> different<br />
chemo<strong>the</strong>rapies (rep<strong>or</strong>ted in Table 44). These<br />
adjustments were applied to a single cycle <strong>of</strong> <strong>the</strong><br />
model and hence we assumed that <strong>the</strong> duration <strong>of</strong><br />
<strong>the</strong> adverse event (and hence <strong>the</strong> decrement)<br />
lasted f<strong>or</strong> a maximum <strong>of</strong> 1 month. Gamma<br />
distributions were assigned to <strong>the</strong>se data f<strong>or</strong> <strong>the</strong><br />
purposes <strong>of</strong> <strong>the</strong> probabilistic analysis, using<br />
method <strong>of</strong> moments.<br />
In <strong>the</strong> absence <strong>of</strong> utility decrements f<strong>or</strong> <strong>the</strong><br />
complete range <strong>of</strong> possible strategies, <strong>the</strong><br />
following assumptions were applied. The<br />
decrement rep<strong>or</strong>ted f<strong>or</strong> docetaxel was applied to<br />
<strong>the</strong> two D + P strategies (3-weekly and weekly).<br />
F<strong>or</strong> <strong>the</strong> docetaxel and estramustine strategies<br />
(D + E and D + E + P 35 and 70), <strong>the</strong> decrement<br />
applied was taken as <strong>the</strong> maximum estimated f<strong>or</strong><br />
docetaxel and estramustine. The decrement<br />
rep<strong>or</strong>ted f<strong>or</strong> mitoxantrone was applied to both <strong>of</strong><br />
<strong>the</strong> mitoxantrone-based comparat<strong>or</strong>s (M + P and<br />
M + P + C). Finally, in <strong>the</strong> absence <strong>of</strong> data f<strong>or</strong> <strong>the</strong><br />
Health Technology Assessment 2007; Vol. 11: No. 2<br />
Health State n Mean SE<br />
Moderate disease 27 0.7319 0.0438<br />
Moderate disease + docetaxel AE 27 0.5972 0.0519<br />
Moderate disease + mitoxantrone AE 27 0.6643 0.0455<br />
Moderate disease + estramustine AE 27 0.6222 0.0482<br />
AE, adverse events.<br />
TABLE 44 Utility decrements applied in <strong>the</strong> sensitivity analysis<br />
Intervention Mean SE Distribution<br />
<strong>Docetaxel</strong> 0.1347 0.0679 Gamma<br />
Mitoxantrone 0.0676 0.0632 Gamma<br />
Estramustine 0.1097 0.0651 Gamma<br />
© Queen’s Printer and Controller <strong>of</strong> HMSO 2007. All rights reserved.<br />
adverse event pr<strong>of</strong>ile rep<strong>or</strong>ted f<strong>or</strong><br />
<strong>prednisone</strong>/<strong>prednisolone</strong>, <strong>the</strong> lowest decrement<br />
across <strong>the</strong> three different interventions was<br />
applied. Although this approach resulted in<br />
similar decrements applied to m<strong>or</strong>e than one<br />
strategy, <strong>the</strong> total impact on <strong>the</strong> QALY calculations<br />
was specific f<strong>or</strong> each intervention, since <strong>the</strong><br />
probability <strong>of</strong> experiencing grade 3/4 adverse<br />
events was separately estimated f<strong>or</strong> each<br />
intervention in <strong>the</strong> Bayesian meta-analysis.<br />
Tables 45 and 46 rep<strong>or</strong>t <strong>the</strong> results <strong>of</strong> <strong>the</strong> sensitivity<br />
analysis including <strong>the</strong> adverse events. The results<br />
demonstrate that <strong>the</strong> ICER appears robust to <strong>the</strong><br />
inclusion <strong>of</strong> adverse events. The ICER <strong>of</strong> D + P<br />
(3-weekly) in comparison <strong>with</strong> M + P increases<br />
marginally to £33,298 per QALY when adverse<br />
events are included (compared <strong>with</strong> £32,706 per<br />
QALY in <strong>the</strong> main analyses).<br />
Variation in <strong>the</strong> health state descriptive<br />
system<br />
Three separate health states were used to describe<br />
<strong>the</strong> progression <strong>of</strong> advanced disease in HRPC in<br />
<strong>or</strong>der to reflect <strong>the</strong> QoL <strong>of</strong> early, moderate and<br />
late disease. These health state descriptions were<br />
devised using data rep<strong>or</strong>ted using FACT-P. F<strong>or</strong> <strong>the</strong><br />
purposes <strong>of</strong> <strong>the</strong> cost-effectiveness analysis, <strong>the</strong>se<br />
estimates were combined to reflect a single utility<br />
value. The utility values f<strong>or</strong> each state (including<br />
<strong>the</strong> combined estimate) are rep<strong>or</strong>ted in Table 47.<br />
The valuations provided f<strong>or</strong> each <strong>of</strong> <strong>the</strong> states, and<br />
<strong>the</strong> combined estimate, were higher than <strong>the</strong><br />
TABLE 45 Analysis 1 – estimates <strong>of</strong> mean lifetime costs and QALYs f<strong>or</strong> D + P (3-weekly), M + P and P, including adjustment f<strong>or</strong><br />
adverse events<br />
Intervention Cost (£) LYG QALY ICER (£) Probability cost-effective (%)<br />
£20,000 £30,000 £40,000<br />
P 11,242 1.51 0.80103 Dominated 41 35 28<br />
M + P 10,801 1.51 0.79917 – 38 29 20<br />
D + P (3-weekly) 15,859 1.80 0.95107 33,298 21 36 51<br />
69


