

Docetaxel with prednisone or prednisolone for the treatment of ...
Docetaxel with prednisone or prednisolone for the treatment of ...
Docetaxel with prednisone or prednisolone for the treatment of ...

Create successful ePaper yourself
Turn your PDF publications into a flip-book with our unique Google optimized e-Paper software.
30<br />
Results<br />
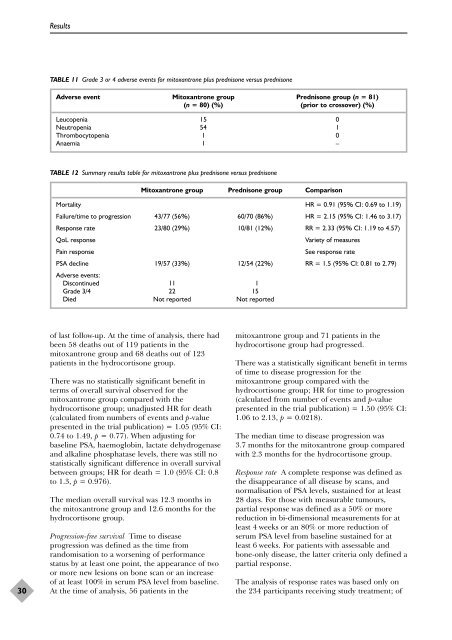
TABLE 11 Grade 3 <strong>or</strong> 4 adverse events f<strong>or</strong> mitoxantrone plus <strong>prednisone</strong> versus <strong>prednisone</strong><br />
Adverse event Mitoxantrone group Prednisone group (n = 81)<br />
(n = 80) (%) (pri<strong>or</strong> to crossover) (%)<br />
Leucopenia 15 0<br />
Neutropenia 54 1<br />
Thrombocytopenia 1 0<br />
Anaemia 1 –<br />
TABLE 12 Summary results table f<strong>or</strong> mitoxantrone plus <strong>prednisone</strong> versus <strong>prednisone</strong><br />
<strong>of</strong> last follow-up. At <strong>the</strong> time <strong>of</strong> analysis, <strong>the</strong>re had<br />
been 58 deaths out <strong>of</strong> 119 patients in <strong>the</strong><br />
mitoxantrone group and 68 deaths out <strong>of</strong> 123<br />
patients in <strong>the</strong> hydroc<strong>or</strong>tisone group.<br />
There was no statistically significant benefit in<br />
terms <strong>of</strong> overall survival observed f<strong>or</strong> <strong>the</strong><br />
mitoxantrone group compared <strong>with</strong> <strong>the</strong><br />
hydroc<strong>or</strong>tisone group; unadjusted HR f<strong>or</strong> death<br />
(calculated from numbers <strong>of</strong> events and p-value<br />
presented in <strong>the</strong> trial publication) = 1.05 (95% CI:<br />
0.74 to 1.49, p = 0.77). When adjusting f<strong>or</strong><br />
baseline PSA, haemoglobin, lactate dehydrogenase<br />
and alkaline phosphatase levels, <strong>the</strong>re was still no<br />
statistically significant difference in overall survival<br />
between groups; HR f<strong>or</strong> death = 1.0 (95% CI: 0.8<br />
to 1.3, p = 0.976).<br />
The median overall survival was 12.3 months in<br />
<strong>the</strong> mitoxantrone group and 12.6 months f<strong>or</strong> <strong>the</strong><br />
hydroc<strong>or</strong>tisone group.<br />
Progression-free survival Time to disease<br />
progression was defined as <strong>the</strong> time from<br />
randomisation to a w<strong>or</strong>sening <strong>of</strong> perf<strong>or</strong>mance<br />
status by at least one point, <strong>the</strong> appearance <strong>of</strong> two<br />
<strong>or</strong> m<strong>or</strong>e new lesions on bone scan <strong>or</strong> an increase<br />
<strong>of</strong> at least 100% in serum PSA level from baseline.<br />
At <strong>the</strong> time <strong>of</strong> analysis, 56 patients in <strong>the</strong><br />
Mitoxantrone group Prednisone group Comparison<br />
M<strong>or</strong>tality HR = 0.91 (95% CI: 0.69 to 1.19)<br />
Failure/time to progression 43/77 (56%) 60/70 (86%) HR = 2.15 (95% CI: 1.46 to 3.17)<br />
Response rate 23/80 (29%) 10/81 (12%) RR = 2.33 (95% CI: 1.19 to 4.57)<br />
QoL response Variety <strong>of</strong> measures<br />
Pain response See response rate<br />
PSA decline 19/57 (33%) 12/54 (22%) RR = 1.5 (95% CI: 0.81 to 2.79)<br />
Adverse events:<br />
Discontinued 11 1<br />
Grade 3/4 22 15<br />
Died Not rep<strong>or</strong>ted Not rep<strong>or</strong>ted<br />
mitoxantrone group and 71 patients in <strong>the</strong><br />
hydroc<strong>or</strong>tisone group had progressed.<br />
There was a statistically significant benefit in terms<br />
<strong>of</strong> time to disease progression f<strong>or</strong> <strong>the</strong><br />
mitoxantrone group compared <strong>with</strong> <strong>the</strong><br />
hydroc<strong>or</strong>tisone group; HR f<strong>or</strong> time to progression<br />
(calculated from number <strong>of</strong> events and p-value<br />
presented in <strong>the</strong> trial publication) = 1.50 (95% CI:<br />
1.06 to 2.13, p = 0.0218).<br />
The median time to disease progression was<br />
3.7 months f<strong>or</strong> <strong>the</strong> mitoxantrone group compared<br />
<strong>with</strong> 2.3 months f<strong>or</strong> <strong>the</strong> hydroc<strong>or</strong>tisone group.<br />
Response rate A complete response was defined as<br />
<strong>the</strong> disappearance <strong>of</strong> all disease by scans, and<br />
n<strong>or</strong>malisation <strong>of</strong> PSA levels, sustained f<strong>or</strong> at least<br />
28 days. F<strong>or</strong> those <strong>with</strong> measurable tumours,<br />
partial response was defined as a 50% <strong>or</strong> m<strong>or</strong>e<br />
reduction in bi-dimensional measurements f<strong>or</strong> at<br />
least 4 weeks <strong>or</strong> an 80% <strong>or</strong> m<strong>or</strong>e reduction <strong>of</strong><br />
serum PSA level from baseline sustained f<strong>or</strong> at<br />
least 6 weeks. F<strong>or</strong> patients <strong>with</strong> assessable and<br />
bone-only disease, <strong>the</strong> latter criteria only defined a<br />
partial response.<br />
The analysis <strong>of</strong> response rates was based only on<br />
<strong>the</strong> 234 participants receiving study <strong>treatment</strong>; <strong>of</strong>


