

Docetaxel with prednisone or prednisolone for the treatment of ...
Docetaxel with prednisone or prednisolone for the treatment of ...
Docetaxel with prednisone or prednisolone for the treatment of ...

Create successful ePaper yourself
Turn your PDF publications into a flip-book with our unique Google optimized e-Paper software.
Probability cost-effective given data<br />
1.0<br />
0.9<br />
0.8<br />
0.7<br />
0.6<br />
0.5<br />
0.4<br />
0.3<br />
0.2<br />
0.1<br />
D + P (3 weekly)<br />
comparat<strong>or</strong>s, <strong>the</strong> final ICER calculations are based<br />
on <strong>the</strong> same non-dominated interventions as in<br />
Analysis 1. Consequently, <strong>the</strong> ICER <strong>of</strong> D + P<br />
(3-weekly) compared <strong>with</strong> M + P is identical to<br />
that presented previously, namely £32,706 per<br />
additional QALY. As a result, <strong>the</strong> same conclusions<br />
can be drawn regarding <strong>the</strong> optimal intervention<br />
based on cost-effectiveness considerations.<br />
Although <strong>the</strong> ICER calculations are <strong>the</strong> same in<br />
both Analyses 1 and 2, <strong>the</strong> addition <strong>of</strong> m<strong>or</strong>e<br />
comparat<strong>or</strong>s results in increased decision<br />
uncertainty. Figure 8 presents <strong>the</strong> CEACs f<strong>or</strong><br />
© Queen’s Printer and Controller <strong>of</strong> HMSO 2007. All rights reserved.<br />
Health Technology Assessment 2007; Vol. 11: No. 2<br />
0<br />
0 5000 10,000 15,000 20,000 25,000 30,000 35,000 40,000 45,000 50,000<br />
Maximum acceptable ratio () (£)<br />
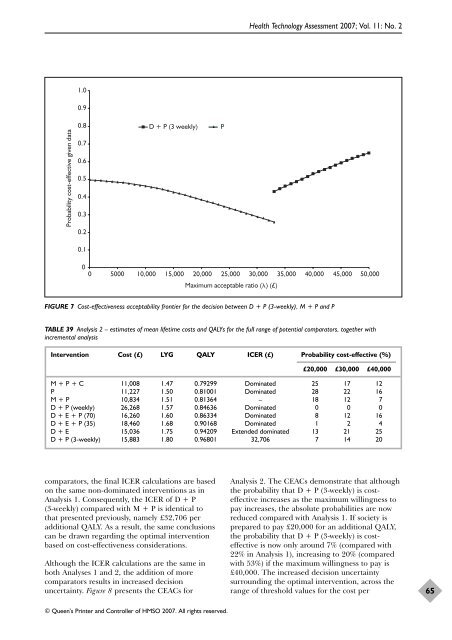
FIGURE 7 Cost-effectiveness acceptability frontier f<strong>or</strong> <strong>the</strong> decision between D + P (3-weekly), M + P and P<br />
TABLE 39 Analysis 2 – estimates <strong>of</strong> mean lifetime costs and QALYs f<strong>or</strong> <strong>the</strong> full range <strong>of</strong> potential comparat<strong>or</strong>s, toge<strong>the</strong>r <strong>with</strong><br />
incremental analysis<br />
P<br />
Intervention Cost (£) LYG QALY ICER (£) Probability cost-effective (%)<br />
£20,000 £30,000 £40,000<br />
M + P + C 11,008 1.47 0.79299 Dominated 25 17 12<br />
P 11,227 1.50 0.81001 Dominated 28 22 16<br />
M + P 10,834 1.51 0.81364 – 18 12 7<br />
D + P (weekly) 26,268 1.57 0.84636 Dominated 0 0 0<br />
D + E + P (70) 16,260 1.60 0.86334 Dominated 8 12 16<br />
D + E + P (35) 18,460 1.68 0.90168 Dominated 1 2 4<br />
D + E 15,036 1.75 0.94209 Extended dominated 13 21 25<br />
D + P (3-weekly) 15,883 1.80 0.96801 32,706 7 14 20<br />
Analysis 2. The CEACs demonstrate that although<br />
<strong>the</strong> probability that D + P (3-weekly) is costeffective<br />
increases as <strong>the</strong> maximum willingness to<br />
pay increases, <strong>the</strong> absolute probabilities are now<br />
reduced compared <strong>with</strong> Analysis 1. If society is<br />
prepared to pay £20,000 f<strong>or</strong> an additional QALY,<br />
<strong>the</strong> probability that D + P (3-weekly) is costeffective<br />
is now only around 7% (compared <strong>with</strong><br />
22% in Analysis 1), increasing to 20% (compared<br />
<strong>with</strong> 53%) if <strong>the</strong> maximum willingness to pay is<br />
£40,000. The increased decision uncertainty<br />
surrounding <strong>the</strong> optimal intervention, across <strong>the</strong><br />
range <strong>of</strong> threshold values f<strong>or</strong> <strong>the</strong> cost per<br />
65


