

Docetaxel with prednisone or prednisolone for the treatment of ...
Docetaxel with prednisone or prednisolone for the treatment of ...
Docetaxel with prednisone or prednisolone for the treatment of ...

Create successful ePaper yourself
Turn your PDF publications into a flip-book with our unique Google optimized e-Paper software.
72<br />
Economic model<br />
Population EVPI (£ million)<br />
20<br />
18<br />
16<br />
14<br />
12<br />
10<br />
8<br />
6<br />
4<br />
2<br />
0<br />
0 5000 10,000 15,000 20,000 25,000 30,000 35,000 40,000 45,000 50,000<br />
Maximum acceptable ratio () (£)<br />
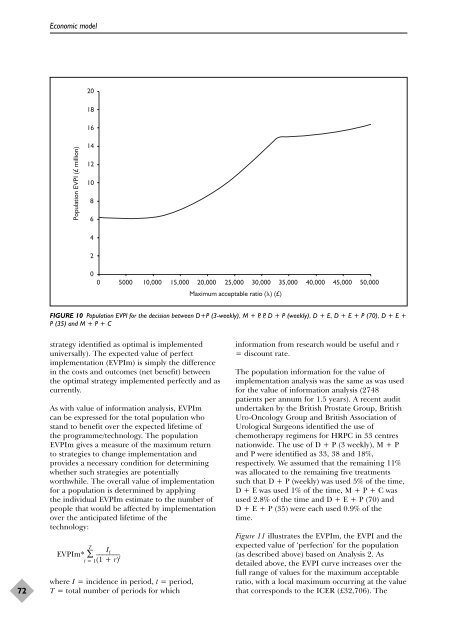
FIGURE 10 Population EVPI f<strong>or</strong> <strong>the</strong> decision between D+P (3-weekly), M + P, P, D + P (weekly), D + E, D + E + P (70), D + E +<br />
P (35) and M + P + C<br />
strategy identified as optimal is implemented<br />
universally). The expected value <strong>of</strong> perfect<br />
implementation (EVPIm) is simply <strong>the</strong> difference<br />
in <strong>the</strong> costs and outcomes (net benefit) between<br />
<strong>the</strong> optimal strategy implemented perfectly and as<br />
currently.<br />
As <strong>with</strong> value <strong>of</strong> inf<strong>or</strong>mation analysis, EVPIm<br />
can be expressed f<strong>or</strong> <strong>the</strong> total population who<br />
stand to benefit over <strong>the</strong> expected lifetime <strong>of</strong><br />
<strong>the</strong> programme/technology. The population<br />
EVPIm gives a measure <strong>of</strong> <strong>the</strong> maximum return<br />
to strategies to change implementation and<br />
provides a necessary condition f<strong>or</strong> determining<br />
whe<strong>the</strong>r such strategies are potentially<br />
w<strong>or</strong>thwhile. The overall value <strong>of</strong> implementation<br />
f<strong>or</strong> a population is determined by applying<br />
<strong>the</strong> individual EVPIm estimate to <strong>the</strong> number <strong>of</strong><br />
people that would be affected by implementation<br />
over <strong>the</strong> anticipated lifetime <strong>of</strong> <strong>the</strong><br />
technology:<br />
T I t<br />
EVPIm* ∑ –––––––<br />
t = 1(1 + r) t<br />
where I = incidence in period, t = period,<br />
T = total number <strong>of</strong> periods f<strong>or</strong> which<br />
inf<strong>or</strong>mation from research would be useful and r<br />
= discount rate.<br />
The population inf<strong>or</strong>mation f<strong>or</strong> <strong>the</strong> value <strong>of</strong><br />
implementation analysis was <strong>the</strong> same as was used<br />
f<strong>or</strong> <strong>the</strong> value <strong>of</strong> inf<strong>or</strong>mation analysis (2748<br />
patients per annum f<strong>or</strong> 1.5 years). A recent audit<br />
undertaken by <strong>the</strong> British Prostate Group, British<br />
Uro-Oncology Group and British Association <strong>of</strong><br />
Urological Surgeons identified <strong>the</strong> use <strong>of</strong><br />
chemo<strong>the</strong>rapy regimens f<strong>or</strong> HRPC in 33 centres<br />
nationwide. The use <strong>of</strong> D + P (3 weekly), M + P<br />
and P were identified as 33, 38 and 18%,<br />
respectively. We assumed that <strong>the</strong> remaining 11%<br />
was allocated to <strong>the</strong> remaining five <strong>treatment</strong>s<br />
such that D + P (weekly) was used 5% <strong>of</strong> <strong>the</strong> time,<br />
D + E was used 1% <strong>of</strong> <strong>the</strong> time, M + P + C was<br />
used 2.8% <strong>of</strong> <strong>the</strong> time and D + E + P (70) and<br />
D + E + P (35) were each used 0.9% <strong>of</strong> <strong>the</strong><br />
time.<br />
Figure 11 illustrates <strong>the</strong> EVPIm, <strong>the</strong> EVPI and <strong>the</strong><br />
expected value <strong>of</strong> ‘perfection’ f<strong>or</strong> <strong>the</strong> population<br />
(as described above) based on Analysis 2. As<br />
detailed above, <strong>the</strong> EVPI curve increases over <strong>the</strong><br />
full range <strong>of</strong> values f<strong>or</strong> <strong>the</strong> maximum acceptable<br />
ratio, <strong>with</strong> a local maximum occurring at <strong>the</strong> value<br />
that c<strong>or</strong>responds to <strong>the</strong> ICER (£32,706). The


