- Page 1 and 2:
MAP Mediterranean Action Plan Energ
- Page 3:
The work schedule was led and coord
- Page 7:
Executive summary Due to the divers
- Page 11 and 12:
SUMMARY REPORT 1. Introduction Summ
- Page 13 and 14:
Summary Report 50 experts took part
- Page 15 and 16:
Summary Report consumption dependin
- Page 17 and 18:
Summary Report The MSSD proposes tw
- Page 19 and 20:
Summary Report 4.2 Clean De velopme
- Page 21 and 22:
Summary Report The resources saved
- Page 23 and 24:
Summary Report Most of the countrie
- Page 25 and 26:
Summary Report buildings, or in cas
- Page 27 and 28:
Summary Report lastly, with the sup
- Page 29 and 30:
8. Attachments Attachment 1 - Activ
- Page 31 and 32:
8.2 At t a c h ment 2 - List o f pa
- Page 33 and 34:
Experts Members of the steering com
- Page 35 and 36:
Experts Members of the steering com
- Page 37 and 38:
Experts Members of the steering com
- Page 39 and 40:
Summary Report 8.3 At t a c h ment
- Page 41 and 42:
Objectives-context-mandate-partnerh
- Page 43 and 44:
DAY 2 - 30 MARCH 2007 Session 3 Rou
- Page 45 and 46:
Access to electricity Summary Repor
- Page 47 and 48:
Summary Report two greenhouse gases
- Page 49 and 50:
Summary Report an important CDM sta
- Page 51 and 52:
Summary Report 8.7 At t a c h ment
- Page 53 and 54:
Mediterranean Strategy for Sustaina
- Page 55 and 56:
Mediterranean Strategy for Sustaina
- Page 57 and 58:
Press release Workshop on "Energy a
- Page 59 and 60:
RAPPORT DE SYNTHESE 1. Introduction
- Page 61 and 62:
Rapport de synthèse d’examiner l
- Page 63 and 64:
Rapport de synthèse la région (qu
- Page 65 and 66:
Rapport de synthèse 3.2 Réponses
- Page 67 and 68:
Rapport de synthèse 4. Cadrage ré
- Page 69 and 70:
Rapport de synthèse 4.3 Les ER et
- Page 71 and 72:
Rapport de synthèse 5. Rapports na
- Page 73 and 74:
Rapport de synthèse nombreuses dan
- Page 75 and 76:
Rapport de synthèse Un autre méca
- Page 77 and 78:
Rapport de synthèse ancien. Ce pro
- Page 79 and 80:
Rapport de synthèse de soumettre
- Page 81 and 82:
8.2 An n e xe 2 - Liste des partici
- Page 83 and 84:
Rapport de synthèse PARTICIPATION
- Page 85 and 86:
Rapport de synthèse PARTICIPATION
- Page 87 and 88:
Rapport de synthèse PARTICIPATION
- Page 89 and 90:
Rapport de synthèse PARTICIPATION
- Page 91 and 92:
Rapport de synthèse PARTICIPATION
- Page 93 and 94:
Rapport de synthèse MEMBRES DU MCS
- Page 95 and 96:
En partenariat avec Commission Méd
- Page 97 and 98:
08h15-8h45 Accueil des participants
- Page 99 and 100:
Rapport de synthèse 8.4 An n e xe
- Page 101 and 102:
Rapport de synthèse côté de l’
- Page 103 and 104:
Rapport de synthèse 33) Pour l’i
- Page 105 and 106:
Rapport de synthèse 8.7 An n e xe
- Page 107 and 108:
Suivi de la Stratégie Méditerran
- Page 109 and 110:
Suivi de la Stratégie Méditerran
- Page 111 and 112:
Communiqué de presse Atelier Éner
- Page 113:
BOSNIA & HERZEGOVINA By Mrs Semra F
- Page 116 and 117:
Energy bill 90 Energy source Oil fo
- Page 118 and 119:
92 ENERGY AND SUSTAINABLE DEVELOPME
- Page 120 and 121:
Facture énergétique 94 ENERGY AND
- Page 122 and 123:
96 ENERGY AND SUSTAINABLE DEVELOPME
- Page 124 and 125:
98 ENERGY AND SUSTAINABLE DEVELOPME
- Page 126 and 127:
100 ENERGY AND SUSTAINABLE DEVELOPM
- Page 128 and 129:
102 ENERGY AND SUSTAINABLE DEVELOPM
- Page 130 and 131:
104 ENERGY AND SUSTAINABLE DEVELOPM
- Page 132 and 133:
106 ENERGY AND SUSTAINABLE DEVELOPM
- Page 134 and 135:
108 ENERGY AND SUSTAINABLE DEVELOPM
- Page 136 and 137:
110 ENERGY AND SUSTAINABLE DEVELOPM
- Page 138 and 139:
112 ENERGY AND SUSTAINABLE DEVELOPM
- Page 140 and 141:
2.2.4 Demand for electricity 114 EN
- Page 142 and 143:
116 ENERGY AND SUSTAINABLE DEVELOPM
- Page 144 and 145:
118 ENERGY AND SUSTAINABLE DEVELOPM
- Page 146 and 147:
120 ENERGY AND SUSTAINABLE DEVELOPM
- Page 148 and 149:
2.3.4 Other impacts on the environm
- Page 150 and 151:
124 ENERGY AND SUSTAINABLE DEVELOPM
- Page 152 and 153:
126 ENERGY AND SUSTAINABLE DEVELOPM
- Page 154 and 155:
128 ENERGY AND SUSTAINABLE DEVELOPM
- Page 156 and 157:
130 ENERGY AND SUSTAINABLE DEVELOPM
- Page 158 and 159:
132 ENERGY AND SUSTAINABLE DEVELOPM
- Page 160 and 161:
134 ENERGY AND SUSTAINABLE DEVELOPM
- Page 162 and 163:
136 ENERGY AND SUSTAINABLE DEVELOPM
- Page 164 and 165:
7. Table of illustrations 138 ENERG
- Page 167:
CYPRUS By M. Costas PAPASTAVROS, Mi
- Page 170 and 171:
144 ENERGY AND SUSTAINABLE DEVELOPM
- Page 173 and 174:
II. RÉSUMÉ 1. Défis et durabilit
- Page 175:
CYPRUS - Résumé d'aide ont été
- Page 178 and 179:
152 ENERGY AND SUSTAINABLE DEVELOPM
- Page 180 and 181:
154 ENERGY AND SUSTAINABLE DEVELOPM
- Page 182 and 183:
156 ENERGY AND SUSTAINABLE DEVELOPM
- Page 184 and 185:
158 ENERGY AND SUSTAINABLE DEVELOPM
- Page 186 and 187:
160 3. Moni power station ENERGY AN
- Page 188 and 189:
162 ENERGY AND SUSTAINABLE DEVELOPM
- Page 190 and 191:
164 ENERGY AND SUSTAINABLE DEVELOPM
- Page 192 and 193:
166 ENERGY AND SUSTAINABLE DEVELOPM
- Page 194 and 195:
168 ENERGY AND SUSTAINABLE DEVELOPM
- Page 196 and 197:
170 ENERGY AND SUSTAINABLE DEVELOPM
- Page 198 and 199:
172 ENERGY AND SUSTAINABLE DEVELOPM
- Page 200 and 201:
174 ENERGY AND SUSTAINABLE DEVELOPM
- Page 202 and 203:
176 ENERGY AND SUSTAINABLE DEVELOPM
- Page 204 and 205:
3.2.3 Facilitating Grid Connection
- Page 206 and 207:
Energy Conservation 180 ENERGY AND
- Page 208 and 209:
182 ENERGY AND SUSTAINABLE DEVELOPM
- Page 210 and 211:
184 ENERGY AND SUSTAINABLE DEVELOPM
- Page 212 and 213:
186 ENERGY AND SUSTAINABLE DEVELOPM
- Page 214 and 215:
3.6.2 Wind Potential (Off shore) 18
- Page 216 and 217:
190 ENERGY AND SUSTAINABLE DEVELOPM
- Page 218 and 219:
Biomass-municipal solid waste 192 E
- Page 220 and 221:
194 ENERGY AND SUSTAINABLE DEVELOPM
- Page 222 and 223:
196 ENERGY AND SUSTAINABLE DEVELOPM
- Page 224 and 225:
198 ENERGY AND SUSTAINABLE DEVELOPM
- Page 226 and 227:
200 ENERGGY AND SUSTAINABLE DEVELOP
- Page 228 and 229:
202 ENERGGY AND SUSTAINABLE DEVELOP
- Page 230 and 231:
204 ENERGY AND SUSTAINABLE DEVELOPM
- Page 232 and 233:
206 ENERGY AND SUSTAINABLE DEVELOPM
- Page 234 and 235:
208 ENERGY AND SUSTAINABLE DEVELOPM
- Page 236 and 237:
4.2 Mari Wind Farm Project 4.2.1 De
- Page 238 and 239:
4.2.3 Technology of the project Typ
- Page 240 and 241:
214 ENERGY AND SUSTAINABLE DEVELOPM
- Page 242 and 243:
216 ENERGY AND SUSTAINABLE DEVELOPM
- Page 244 and 245:
218 ENERGY AND SUSTAINABLE DEVELOPM
- Page 246 and 247:
220 ENERGY AND SUSTAINABLE DEVELOPM
- Page 248 and 249:
222 ENERGY AND SUSTAINABLE DEVELOPM
- Page 250 and 251:
224 ENERGY AND SUSTAINABLE DEVELOPM
- Page 252 and 253:
226 ENERGY AND SUSTAINABLE DEVELOPM
- Page 254 and 255:
B. Projections - Policies and Measu
- Page 257 and 258:
I. SUMMARY EGYPT - Summary 1. Egypt
- Page 259 and 260:
EGYPT - Summary To assess RUE and R
- Page 261 and 262:
II. RESUME EGYPT - Résumé 1. L’
- Page 263 and 264:
EGYPT - Résumé 5,2 MW, couvrant l
- Page 265 and 266:
III. NATIONAL STUDY EGYPT - Nationa
- Page 267 and 268:
EGYPT - National study Second, a gr
- Page 269 and 270:
Number of jobs in the energy sector
- Page 271 and 272:
EGYPT - National study Figure 2 Egy
- Page 273 and 274:
EGYPT - National study Table 3 Summ
- Page 275 and 276:
EGYPT - National study includes ens
- Page 277 and 278:
EGYPT - National study Sector 95/96
- Page 279 and 280:
EGYPT - National study 1.3.3 Evolut
- Page 281 and 282:
EGYPT - National study 17 mtoe, rea
- Page 283 and 284:
EGYPT - National study Petroleum Pe
- Page 285 and 286:
EGYPT - National study 3) A 120 MW
- Page 287 and 288:
EGYPT - National study To satisfy t
- Page 289 and 290:
EGYPT - National study More than 90
- Page 291 and 292:
EGYPT - National study negative imp
- Page 293 and 294:
Previous and current RUE programs P
- Page 295 and 296:
EGYPT - National study Developing s
- Page 297 and 298:
EGYPT - National study Egyptian aut
- Page 299 and 300:
Order and Name of Plant Zafarana (1
- Page 301 and 302:
EGYPT - National study Announcing t
- Page 303 and 304:
EGYPT - National study Table 15 Evo
- Page 305 and 306:
EGYPT - National study from CERs re
- Page 307 and 308:
EGYPT - National study The existing
- Page 309 and 310:
EGYPT - National study For Manual r
- Page 311 and 312:
EGYPT - National study The Governme
- Page 313 and 314:
EGYPT - National study Figure 8 Win
- Page 315 and 316:
EGYPT - National study achievements
- Page 317 and 318:
EGYPT - National study and the deve
- Page 319 and 320:
5. Table of illustrations EGYPT - N
- Page 321 and 322:
EGYPT - National study Figure 9 Sol
- Page 323 and 324:
EGYPT - National study Figure 11 Wi
- Page 325 and 326:
EGYPT - National study Annex II: Ev
- Page 327 and 328:
EGYPT - National study Reviewing Ta
- Page 329 and 330:
Annex IV: List of main references E
- Page 331:
ISRAEL Dr. Amit Mor, Dr. Shimon Ser
- Page 334 and 335:
308 ENERGY AND SUSTAINABLE DEVELOPM
- Page 337 and 338:
II. RÉSUMÉ 1. Défis et durabilit
- Page 339:
ISRAEL - Résumé Quelques recomman
- Page 342 and 343:
316 ENERGY AND SUSTAINABLE DEVELOPM
- Page 344 and 345:
318 ENERGY AND SUSTAINABLE DEVELOPM
- Page 346 and 347:
320 ENERGY AND SUSTAINABLE DEVELOPM
- Page 348 and 349:
322 ENERGY AND SUSTAINABLE DEVELOPM
- Page 350 and 351:
324 ENERGY AND SUSTAINABLE DEVELOPM
- Page 352 and 353:
326 ENERGY AND SUSTAINABLE DEVELOPM
- Page 354 and 355:
328 ENERGY AND SUSTAINABLE DEVELOPM
- Page 356 and 357:
330 ENERGY AND SUSTAINABLE DEVELOPM
- Page 358 and 359:
332 ENERGY AND SUSTAINABLE DEVELOPM
- Page 360 and 361:
334 ENERGY AND SUSTAINABLE DEVELOPM
- Page 362 and 363:
336 ENERGY AND SUSTAINABLE DEVELOPM
- Page 364 and 365:
338 ENERGY AND SUSTAINABLE DEVELOPM
- Page 367:
ITALY Mrs Carmen Glorioso, Mr Mario
- Page 370 and 371:
344 ENERGY AND SUSTAINABLE DEVELOPM
- Page 372 and 373:
346 ENERGY AND SUSTAINABLE DEVELOPM
- Page 374 and 375:
348 ENERGY AND SUSTAINABLE DEVELOPM
- Page 376 and 377:
350 ENERGY AND SUSTAINABLE DEVELOPM
- Page 378 and 379:
352 ENERGY AND SUSTAINABLE DEVELOPM
- Page 380 and 381:
354 ENERGY AND SUSTAINABLE DEVELOPM
- Page 382 and 383:
356 ENERGY AND SUSTAINABLE DEVELOPM
- Page 384 and 385:
358 ENERGY AND SUSTAINABLE DEVELOPM
- Page 386 and 387:
360 ENERGY AND SUSTAINABLE DEVELOPM
- Page 388 and 389:
362 ENERGY AND SUSTAINABLE DEVELOPM
- Page 390 and 391:
364 ENERGY AND SUSTAINABLE DEVELOPM
- Page 392 and 393:
366 ENERGY AND SUSTAINABLE DEVELOPM
- Page 394 and 395:
368 ENERGY AND SUSTAINABLE DEVELOPM
- Page 396 and 397:
5. Table of illustrations 370 ENERG
- Page 399 and 400:
I. SUMMARY 1. Libya Energy Situatio
- Page 401:
LIBYA - Summary in the power genera
- Page 404 and 405:
378 ENERGY AND SUSTAINABLE DEVELOPM
- Page 407 and 408:
III. NATIONAL STUDY 1. The country
- Page 409 and 410:
1.3.2 Electrical energy demand LIBY
- Page 411 and 412:
LIBYA - National study entire Libya
- Page 413 and 414:
3.1.1 Solar radiation LIBYA - Natio
- Page 415 and 416:
LIBYA - National study It was the s
- Page 417 and 418: PV for Water pumping LIBYA - Nation
- Page 419 and 420: 3.3.2 Thermal Conversion LIBYA - Na
- Page 421 and 422: Manufacturing Supportive: Training
- Page 423 and 424: LIBYA - National study a yearly 35%
- Page 425 and 426: Array output energy LIBYA - Nationa
- Page 427 and 428: LIBYA - National study fundamental
- Page 429 and 430: LIBYA - National study Quality cont
- Page 431 and 432: 4.3.2 Project’s Objective LIBYA -
- Page 433 and 434: LIBYA - National study in 30 km (22
- Page 435 and 436: LIBYA - National study 1) Low elect
- Page 437: 7. List of illustrations LIBYA - Na
- Page 441 and 442: I. SUMMARY MALTA - Summary 1. Chall
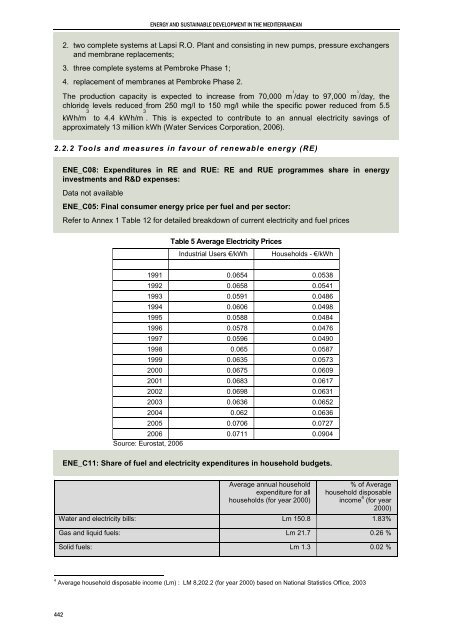
- Page 443: MALTA - Summary contributed to a re
- Page 446 and 447: 420 ENERGY AND SUSTAINABLE DEVELOPM
- Page 449 and 450: III. NATIONAL STUDY 1. The energy s
- Page 451 and 452: MALTA - National study up of differ
- Page 453 and 454: MALTA - National study feasible pen
- Page 455 and 456: Enemalta Corporation, 2006a MALTA -
- Page 457 and 458: Year Used in station - MWh Consumpt
- Page 459 and 460: MALTA - National study 1.3 Impa cts
- Page 461 and 462: MALTA - National study new entrants
- Page 463 and 464: MALTA - National study Set plans an
- Page 465 and 466: g) Energy performance in buildings.
- Page 467: MALTA - National study Figure 5 Pre
- Page 471 and 472: MALTA - National study the measures
- Page 473 and 474: 3. Product development 4. Testing a
- Page 475 and 476: Table 2) 2.3.1 Energy Intensity MAL
- Page 477 and 478: MALTA - National study Table 7 Fina
- Page 479 and 480: MALTA - National study Property own
- Page 481 and 482: MALTA - National study policies to
- Page 483 and 484: MALTA - National study Table 8 Powe
- Page 485 and 486: MALTA - National study Table 12 Sum
- Page 487 and 488: MALTA - National study These tariff
- Page 489 and 490: MALTA - National study Suri, M. Hul
- Page 491: MAROC Berdai Mohamed, CDER (Centre
- Page 494 and 495: 468 ENERGIE ET DEVELOPPEMENT DURABL
- Page 496 and 497: 470 ENERGIE ET DEVELOPPEMENT DURABL
- Page 498 and 499: 472 ENERGIE ET DEVELOPPEMENT DURABL
- Page 500 and 501: 474 ENERGIE ET DEVELOPPEMENT DURABL
- Page 502 and 503: 476 quantité de charbon en Tonnes
- Page 504 and 505: 478 ENERGIE ET DEVELOPPEMENT DURABL
- Page 506 and 507: Gaz Naturel 480 Quantité Butane (T
- Page 508 and 509: 1.4.1 Investissements 2007 - 2012 4
- Page 510 and 511: 484 ENERGIE ET DEVELOPPEMENT DURABL
- Page 512 and 513: 486 ENERGIE ET DEVELOPPEMENT DURABL
- Page 514 and 515: 488 ENERGIE ET DEVELOPPEMENT DURABL
- Page 516 and 517: 490 ENERGIE ET DEVELOPPEMENT DURABL
- Page 518 and 519:
492 ENERGIE ET DEVELOPPEMENT DURABL
- Page 520 and 521:
494 ENERGIE ET DEVELOPPEMENT DURABL
- Page 522 and 523:
3.2.2 Résultats et enseignements 4
- Page 524 and 525:
498 ENERGIE ET DEVELOPPEMENT DURABL
- Page 526 and 527:
500 ENERGIE ET DEVELOPPEMENT DURABL
- Page 528 and 529:
5. Bibliographie 502 ENERGIE ET DEV
- Page 530 and 531:
Annexe 1 504 ENERGIE ET DEVELOPPEME
- Page 532 and 533:
Annexe 3 506 ENERGIE ET DEVELOPPEME
- Page 534 and 535:
Annexe 5 508 ENERGIE ET DEVELOPPEME
- Page 537 and 538:
I. SUMMARY SYRIA - Summary 1. Chall
- Page 539 and 540:
II. RÉSUMÉ 1. Défis et durabilit
- Page 541:
5. Les Success stories SYRIA - Rés
- Page 544 and 545:
518 ENERGY AND SUSTAINABLE DEVELOPM
- Page 546 and 547:
520 ENERGY AND SUSTAINABLE DEVELOPM
- Page 548 and 549:
522 MINISTRY OF IRRIGATION Public E
- Page 550 and 551:
524 ENERGY AND SUSTAINABLE DEVELOPM
- Page 552 and 553:
526 Total installed capacity Steam
- Page 554 and 555:
528 Bio 25.84% ENERGY AND SUSTAINAB
- Page 556 and 557:
1-2- Thermal electricity production
- Page 558 and 559:
532 ENERGY AND SUSTAINABLE DEVELOPM
- Page 560 and 561:
534 ENERGY AND SUSTAINABLE DEVELOPM
- Page 562 and 563:
536 10 11 12 13 14 15 16 17 18 19 M
- Page 564 and 565:
538 ENERGY AND SUSTAINABLE DEVELOPM
- Page 566 and 567:
540 ENERGY AND SUSTAINABLE DEVELOPM
- Page 568 and 569:
In Electrical Distribution Side: 54
- Page 570 and 571:
544 ENERGY AND SUSTAINABLE DEVELOPM
- Page 572 and 573:
546 ENERGY AND SUSTAINABLE DEVELOPM
- Page 574 and 575:
548 ENERGY AND SUSTAINABLE DEVELOPM
- Page 576 and 577:
550 ENERGY AND SUSTAINABLE DEVELOPM
- Page 578 and 579:
552 ENERGY AND SUSTAINABLE DEVELOPM
- Page 580 and 581:
554 ENERGY AND SUSTAINABLE DEVELOPM
- Page 582 and 583:
556 ENERGY AND SUSTAINABLE DEVELOPM
- Page 584 and 585:
The main reasons of the grid loss:
- Page 586 and 587:
560 ENERGY AND SUSTAINABLE DEVELOPM
- Page 588 and 589:
562 ENERGY AND SUSTAINABLE DEVELOPM
- Page 590 and 591:
564 ENERGY AND SUSTAINABLE DEVELOPM
- Page 592 and 593:
566 ENERGY AND SUSTAINABLE DEVELOPM
- Page 594 and 595:
4.2.2 Main tools 568 ENERGY AND SUS
- Page 596 and 597:
5. List of illustrations 570 ENERGY
- Page 599 and 600:
I. SUMMARY TURKEY - Summary 1. Chal
- Page 601 and 602:
TURKEY - Summary Table 5 Present an
- Page 603 and 604:
TURKEY - Summary Figure 2 Energy an
- Page 605 and 606:
II. RESUME 1. Défis et durabilité
- Page 607 and 608:
TURKEY - Résumé Tableau 5 Product
- Page 609 and 610:
TURKEY - Résumé Figure 4 Moyenne
- Page 611 and 612:
III. NATIONAL STUDY 1. The Country
- Page 613 and 614:
TURKEY - National Study projections
- Page 615 and 616:
TURKEY - National Study Table 13 Di
- Page 617 and 618:
TURKEY - National Study Table 19 Tu
- Page 619 and 620:
TURKEY - National Study 3) A new re
- Page 621 and 622:
TURKEY - National Study adjacent to
- Page 623 and 624:
TURKEY - National Study Table 26 Pr
- Page 625 and 626:
Consumption (ktoe) 70000 60000 5000
- Page 627 and 628:
TURKEY - National Study (TPPs), con
- Page 629 and 630:
TURKEY - National Study The state-o
- Page 631 and 632:
TURKEY - National Study stable over
- Page 633 and 634:
TURKEY - National Study Table 38 Ma
- Page 635 and 636:
CO2 Emission (million ton) 1000 900
- Page 637 and 638:
TURKEY - National Study Table 43 Wi
- Page 639 and 640:
TURKEY - National Study Table 47 Th
- Page 641 and 642:
TURKEY - National Study Table 50 Un
- Page 643 and 644:
TURKEY - National Study Government
- Page 645 and 646:
TURKEY - National Study Table 54 No
- Page 647 and 648:
TURKEY - National Study could bring
- Page 649 and 650:
TURKEY - National Study Figure 13 O
- Page 651 and 652:
TURKEY - National Study As living s
- Page 653 and 654:
TURKEY - National Study highest in
- Page 655 and 656:
TURKEY - National Study Biogas syst
- Page 657 and 658:
TURKEY - National Study In Turkey,
- Page 659 and 660:
TURKEY - National Study Figure 18 A
- Page 661 and 662:
Customer Benefits TURKEY - National
- Page 663 and 664:
TURKEY - National Study Table 65 Di
- Page 665 and 666:
TURKEY - National Study Figure 20 W
- Page 667 and 668:
TURKEY - National Study Figure 21 F
- Page 669 and 670:
TURKEY - National Study Injection t
- Page 671 and 672:
TURKEY - National Study Table 72 Ma
- Page 673 and 674:
TURKEY - National Study municipalit
- Page 675 and 676:
TURKEY - National Study Table 75 An
- Page 677 and 678:
TURKEY - National Study Table 78 Br
- Page 679 and 680:
TURKEY - National Study Table 80 Pr
- Page 681 and 682:
TURKEY - National Study Table 83 Pe
- Page 683 and 684:
TURKEY - National Study Table 85 Tu
- Page 685 and 686:
TURKEY - National Study Table 87 Op
- Page 687 and 688:
TURKEY - National Study Table 94 Co
- Page 689 and 690:
TURKEY - National Study Table 98 Hy
- Page 691 and 692:
TURKEY - National Study Table 102 E
- Page 693 and 694:
TURKEY - National Study Table 107 E
- Page 695 and 696:
TURKEY - National Study Table 111 D
- Page 697 and 698:
TURKEY - National Study Table 116 P
- Page 699 and 700:
TURKEY - National Study [29] Kilic
- Page 701 and 702:
TURKEY - National Study [85] Hepbas
- Page 703 and 704:
TURKEY - National Study [140] Utlu
- Page 705 and 706:
TURKEY - National Study Table 53 Va
- Page 707 and 708:
LIST OF MAP TECHNICAL SERIES REPORT
- Page 709 and 710:
MTS 136. UNEP/MAP/MED POL: Guidelin
- Page 711 and 712:
MTS 97. UNEP/MAP/FAO: Final reports
- Page 713 and 714:
MTS 58. UNEP/MAP/FAO/WHO/IAEA: Asse
- Page 715 and 716:
MTS 21. UNEP/MAP/UNESCO/FAO: Eutrop