- Page 1 and 2:
A GENDER LENS ON ROWAN UNIVERSITY
- Page 3 and 4:
EXECUTIVE SUMMARY BACKGROUND TO THE
- Page 5 and 6:
the program? In particular, how do
- Page 7 and 8:
various aspects of the program and
- Page 9 and 10:
However, the empowering effect of t
- Page 11 and 12:
with the delivery of lab work, team
- Page 13 and 14:
The perception of problems for wome
- Page 15 and 16:
• Have as high or higher academic
- Page 17 and 18:
These are important findings for an
- Page 19 and 20:
CHAPTER I-A INTRODUCTION The under-
- Page 21 and 22:
incorporate an inclusive pedagogica
- Page 23 and 24:
has specifically been advocated as
- Page 25 and 26:
affect intellectual identity and ac
- Page 27 and 28:
CLIMATE ISSUES DIFFICULT FOR WOMEN
- Page 29 and 30:
atmosphere separates students from
- Page 31 and 32:
successfully serve as a model for m
- Page 33 and 34:
uilt itself up into a full-fledged
- Page 35 and 36:
sensitive policy to sophomore year
- Page 37 and 38:
work together to continuously creat
- Page 39 and 40:
that students, in their exit interv
- Page 41 and 42:
presentations convincing to practic
- Page 43 and 44:
chapter on campus, which sponsors s
- Page 45 and 46:
academic year and their satisfactio
- Page 47 and 48:
Additional Information from Univers
- Page 49 and 50:
CHAPTER I-D THE ROWAN ENGINEERING S
- Page 51 and 52:
The rest of this chapter is based o
- Page 53 and 54:
TABLE ID-3 COHORT BY MAJOR (%’s)
- Page 55 and 56:
TABLE 1D-4 PERCENTAGE FEMALE IN MAJ
- Page 57 and 58:
Academic Achievement The level of a
- Page 59 and 60:
TABLE ID-6 PRE-COLLEGE ACADEMIC ACH
- Page 61 and 62:
London, 1992). Almost a third of th
- Page 63 and 64:
Parental occupations of male studen
- Page 65 and 66:
As we have mentioned above, about h
- Page 67 and 68:
All of the support items were recod
- Page 69 and 70:
science field. Males and females sh
- Page 71 and 72:
5) pre-college academic preparation
- Page 73 and 74:
program. Other students may opt to
- Page 75 and 76:
confidence at the beginning of each
- Page 77 and 78:
STUDENT INPUT Family and Socio- Dem
- Page 79 and 80:
CHAPTER II-B THE RELATIONSHIP BETWE
- Page 81 and 82:
making up this factor, while 22.4%
- Page 83 and 84:
(CONF STAY ENG) as the dependent va
- Page 85 and 86:
contrary to our expectations, it is
- Page 87 and 88:
students is .568, and for all stude
- Page 89 and 90:
However, the importance of backgrou
- Page 91 and 92:
TABLE IIB-4 MULTIPLE REGRESSION ANA
- Page 93 and 94:
oth that they will stay with engine
- Page 95 and 96:
The main gender differences through
- Page 97 and 98:
CHAPTER II-C ENGINEERING BEHAVIOR A
- Page 99 and 100:
grades is statistically significant
- Page 101 and 102:
shows us that the impact of both fa
- Page 103 and 104:
men’s and their mean GPA in engin
- Page 105 and 106:
TABLE IIC-4 ACADEMIC PERFORMANCE BY
- Page 107 and 108:
(1) The first type of involvement r
- Page 109 and 110:
participation in enrichment activit
- Page 111 and 112:
Having a sibling who went to colleg
- Page 113 and 114:
These background characteristics ha
- Page 115 and 116: In sum, in terms of enrichment acti
- Page 117 and 118: Table IIC-11 SUPPORT BY FACULTY BY
- Page 119 and 120: For males, living with other scienc
- Page 121 and 122: TABLE IIC-14 PARTICIPATION IN HELP
- Page 123 and 124: primarily the male’s career couns
- Page 125 and 126: Finally, involvement in non-enginee
- Page 127 and 128: The Rowan engineering females fall
- Page 129 and 130: members to have slightly higher GPA
- Page 131 and 132: CHAPTER II-D CHANGES IN ENGINEERING
- Page 133 and 134: However, there is a gender differen
- Page 135 and 136: Considering the possibility that no
- Page 137 and 138: achievement. Academic self-confiden
- Page 139 and 140: While the four self-confidence fact
- Page 141 and 142: We separated our analysis by year i
- Page 143 and 144: Similarly, for junior females, a hi
- Page 145 and 146: In summary, we can see that over th
- Page 147 and 148: in their computer skills and in the
- Page 149 and 150: TABLE IID-3 CHANGE IN SELF-CONFIDEN
- Page 151 and 152: engineering as the right major for
- Page 153 and 154: TABLE IID-5 MEAN GRADE POINT AVERAG
- Page 155 and 156: the senior year, we find the larges
- Page 157 and 158: The programmatic elements of most i
- Page 159 and 160: elated to satisfaction at the end o
- Page 161 and 162: The second indicator of satisfactio
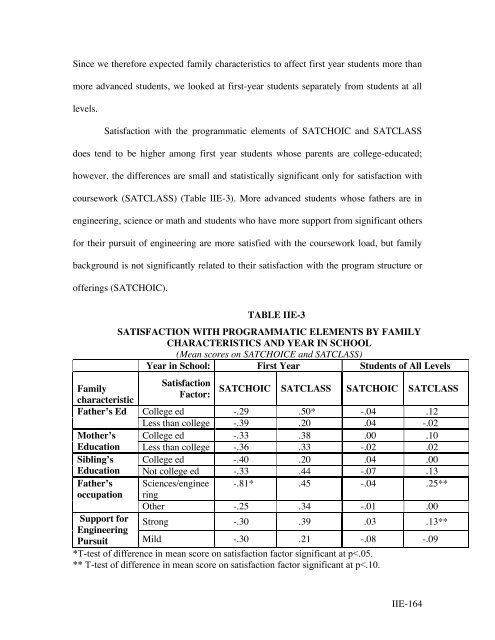
- Page 163 and 164: of classroom hours”, “are frien
- Page 165: Satisfaction Item TABLE IIE-2 SATIS
- Page 169 and 170: TABLE IIE-5 MULTIPLE CORRELATIONS R
- Page 171 and 172: TABLE IIE-6 MULTIPLE REGRESSION ANA
- Page 173 and 174: with team work is lowest in the jun
- Page 175 and 176: High School Background High school
- Page 177 and 178: teams are also more likely to join
- Page 179 and 180: Satisfaction Item TABLE IIE-12 SATI
- Page 181 and 182: TABLE IIE-14 SATISFACTION WITH INTE
- Page 183 and 184: TABLE IIE-16 MULTIPLE REGRESSION AN
- Page 185 and 186: course of the academic year. It cou
- Page 187 and 188: gender difference are female studen
- Page 189 and 190: a. Labwork (SATLAB) There is no gen
- Page 191 and 192: TABLE IIE-22 SATISFACTION WITH ENGI
- Page 193 and 194: indicated that there does not seem
- Page 195 and 196: I. Programmatic Elements a-b. Satis
- Page 197 and 198: II. Satisfaction with Applied Aspec
- Page 199 and 200: administered during the different y
- Page 201 and 202: higher among seniors. For both male
- Page 203 and 204: TABLE IIE-26 MEAN SATISFACTION WITH
- Page 205 and 206: engineering self-confidence was sim
- Page 207 and 208: previous research, which suggests t
- Page 209 and 210: WOMEN’S PARTICIPATION IN SWE AND
- Page 211 and 212: ole models for engineering in the f
- Page 213 and 214: difference in satisfaction with the
- Page 215 and 216: program do not exhibit poorer pre-c
- Page 217 and 218:
Cohort beginning year: TABLE IIF-1
- Page 219 and 220:
Looking at gender differences in re
- Page 221 and 222:
from the university, or if they had
- Page 223 and 224:
TABLE IIF-5 ENGINEERING “STAYERS
- Page 225 and 226:
Leavers were less involved in engin
- Page 227 and 228:
TABLE IIF-9 ENGINEERING SELF-CONFID
- Page 229 and 230:
TABLE IIF-11 ACADEMIC ACHIEVEMENT O
- Page 231 and 232:
TABLE IIF-13 PARTICIPATION IN ENGIN
- Page 233 and 234:
TABLE IIF-14 ENGINEERING SELF-CONFI
- Page 235 and 236:
TABLE IIF-15 SATISFACTION WITH ROWA
- Page 237 and 238:
Previous research has suggested tha
- Page 239 and 240:
expected women’s perception of pr
- Page 241 and 242:
(4) We also expected the perception
- Page 243 and 244:
I’ll get hired somewhere.” Whil
- Page 245 and 246:
Remember that Rowan students were a
- Page 247 and 248:
As standardized factor scores, the
- Page 249 and 250:
We also could analyze the perceptio
- Page 251 and 252:
TABLE IIG-5 PERCEPTION OF PROBLEMS
- Page 253 and 254:
TABLE IIG-7 CHANGE IN PERCEPTION OF
- Page 255 and 256:
presumably with an understanding th
- Page 257 and 258:
correlations of each of the factors
- Page 259 and 260:
the junior female students to perce
- Page 261 and 262:
CHANGE IN PERCEPTION OF PROBLEMS OV
- Page 263 and 264:
TABLE IIG-13 CHANGE IN PERCEPTION O
- Page 265 and 266:
Issue TABLE IIG-14 CHANGE IN PERCEP
- Page 267 and 268:
TABLE IIG-17 PERCEPTIONS OF PROBLEM
- Page 269 and 270:
CHAPTER II-H COMPARISONS TO OTHER S
- Page 271 and 272:
TABLE IIH-1 ENGINEERING SELF-CONFID
- Page 273 and 274:
Rowan females are also more involve
- Page 275 and 276:
TABLE IIH-3 PARTICIPATION IN SELECT
- Page 277 and 278:
females agreed or strongly agreed t
- Page 279 and 280:
males vs. 50.0% females); at Rowan,
- Page 281 and 282:
Purpose of the Study PART III SUMMA
- Page 283 and 284:
Evidence that Rowan’s Program is
- Page 285 and 286:
tend to be more satisfied with the
- Page 287 and 288:
It is important to note that having
- Page 289 and 290:
new program, many changes were inst
- Page 291 and 292:
Cunningham, Christine M., Cathy Lac
- Page 293 and 294:
Marchese, A. J., Schmalzel, J. L, M
- Page 295 and 296:
Tinto, V. 1993. Leaving College: Re
- Page 297 and 298:
ENGINEERING STUDENT SURVEY I Dear S
- Page 299 and 300:
Family Background 11.What was the h
- Page 301 and 302:
29a. Did you ever have a female tea
- Page 303 and 304:
40. The statements listed below hav
- Page 305 and 306:
Name__________________ Social Secur
- Page 307 and 308:
7. During this academic year, how f
- Page 309 and 310:
26. From your experience, engineeri
- Page 311 and 312:
37. The statements listed below hav
- Page 313 and 314:
1. Your background, how long at Row
- Page 315:
APPENDIX B ENGINEERING SELF-CONFIDE