

Thesis - faculty.ait.ac.th - Asian Institute of Technology
Thesis - faculty.ait.ac.th - Asian Institute of Technology
Thesis - faculty.ait.ac.th - Asian Institute of Technology

Create successful ePaper yourself
Turn your PDF publications into a flip-book with our unique Google optimized e-Paper software.
Where,<br />
Ss = Oxygen consumption for Ss * 100 Eq. 4.4<br />
(1-Y) * CODT<br />
Xs = Oxygen consumption for Xs * 100 Eq. 4.5<br />
(1-Y) * CODT<br />
Oxygen consumption for Ss = Area I<br />
Oxygen consumption for Xs = Area II<br />
Based on <strong>th</strong>e area covered by <strong>th</strong>e curve (area I), readily biodegradable COD, is equal<br />
to 40% <strong>of</strong> total area while area II, slowly biodegradable COD, is equal to 60% <strong>of</strong> total area.<br />
Thus, it could be said <strong>th</strong>at among <strong>th</strong>e biodegradation COD, readily degradable components<br />
are just 40% compared to <strong>th</strong>at <strong>of</strong> <strong>th</strong>e slowly degradable component. This shows <strong>th</strong>e<br />
recalcitrant nature <strong>of</strong> <strong>th</strong>e le<strong>ac</strong>hate and <strong>th</strong>e requirement <strong>of</strong> a long HRT for complete<br />
degradation <strong>of</strong> <strong>th</strong>e biodegradable components. Based on <strong>th</strong>e result, <strong>th</strong>e estimated readily<br />
biodegradable COD can be degraded wi<strong>th</strong>in 12 h.<br />
Though OUR experiments suggest <strong>th</strong>e readily biodegradable and slowly<br />
biodegradable components <strong>of</strong> <strong>th</strong>e biodegradable COD, it does not <strong>ac</strong>tually tell <strong>th</strong>e total<br />
biodegradable content present in <strong>th</strong>e le<strong>ac</strong>hate. To fur<strong>th</strong>er investigate on <strong>th</strong>is aspect, a 20<br />
days BOD was measured. It has suggested by Henze (1992) <strong>th</strong>at <strong>th</strong>e fr<strong>ac</strong>tions <strong>of</strong> organic<br />
matter in wastewater which are measured in terms <strong>of</strong> OUR and BOD5 are similar. Thus,<br />
<strong>th</strong>e relation between <strong>th</strong>e COD fr<strong>ac</strong>tion and BOD concentration may suggest <strong>th</strong>e<br />
biodegradability <strong>of</strong> <strong>th</strong>e le<strong>ac</strong>hate.<br />
When <strong>th</strong>e 20 days BOD <strong>of</strong> <strong>th</strong>e raw le<strong>ac</strong>hate, stripped le<strong>ac</strong>hate, b<strong>ac</strong>terial and <strong>th</strong>e yeast<br />
effluent were measured, <strong>th</strong>e trend <strong>of</strong> increase in BOD was similar for raw and stripped<br />
le<strong>ac</strong>hate. The trend <strong>of</strong> increase in BOD for <strong>th</strong>e yeast and b<strong>ac</strong>terial effluent for <strong>th</strong>e first 10<br />
days was similar. The trend <strong>of</strong> <strong>th</strong>e 20 days BOD is given in Figure 4.37 and 4.38. The raw<br />
data is given in Table H-1 <strong>of</strong> Appendix H.<br />
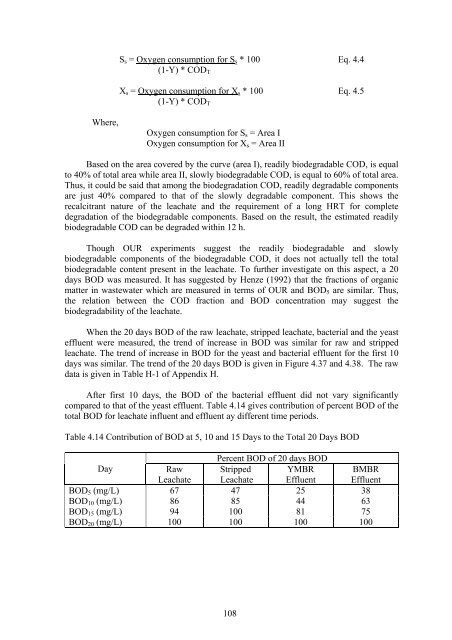
After first 10 days, <strong>th</strong>e BOD <strong>of</strong> <strong>th</strong>e b<strong>ac</strong>terial effluent did not vary significantly<br />
compared to <strong>th</strong>at <strong>of</strong> <strong>th</strong>e yeast effluent. Table 4.14 gives contribution <strong>of</strong> percent BOD <strong>of</strong> <strong>th</strong>e<br />
total BOD for le<strong>ac</strong>hate influent and effluent ay different time periods.<br />
Table 4.14 Contribution <strong>of</strong> BOD at 5, 10 and 15 Days to <strong>th</strong>e Total 20 Days BOD<br />
Percent BOD <strong>of</strong> 20 days BOD<br />
Day Raw Stripped YMBR BMBR<br />
Le<strong>ac</strong>hate Le<strong>ac</strong>hate Effluent Effluent<br />
BOD5 (mg/L) 67 47 25 38<br />
BOD10 (mg/L) 86 85 44 63<br />
BOD15 (mg/L) 94 100 81 75<br />
BOD20 (mg/L) 100 100 100 100<br />
108


