

Thesis - faculty.ait.ac.th - Asian Institute of Technology
Thesis - faculty.ait.ac.th - Asian Institute of Technology
Thesis - faculty.ait.ac.th - Asian Institute of Technology

You also want an ePaper? Increase the reach of your titles
YUMPU automatically turns print PDFs into web optimized ePapers that Google loves.
cake used on <strong>th</strong>e top <strong>of</strong> <strong>th</strong>e membrane usually <strong>ac</strong>ts as a secondary membrane which retains<br />
protein aggregates, reducing protein fouling <strong>of</strong> <strong>th</strong>e primary membrane (Guell, et al., 1999).<br />
These could be <strong>th</strong>e reasons for lower membrane fouling in <strong>th</strong>e yeast membrane.<br />
The protein and carbohydrates form <strong>th</strong>e main component <strong>of</strong> <strong>th</strong>e EPS; because <strong>of</strong><br />
<strong>th</strong>ese <strong>th</strong>e EPS components were also measured. It is also interesting to note <strong>th</strong>at <strong>th</strong>e protein<br />
to carbohydrate ratio in <strong>th</strong>e bound EPS was higher in yeast re<strong>ac</strong>tor <strong>th</strong>an <strong>th</strong>e b<strong>ac</strong>terial<br />
re<strong>ac</strong>tor and <strong>th</strong>e protein to carbohydrate ratio in <strong>th</strong>e soluble EPS was higher in <strong>th</strong>e b<strong>ac</strong>terial<br />
re<strong>ac</strong>tor <strong>th</strong>an <strong>th</strong>e yeast re<strong>ac</strong>tor. This may suggest <strong>th</strong>at higher protein to carbohydrate ratio<br />
plays a more important role in membrane fouling, if present in <strong>th</strong>e soluble EPS ra<strong>th</strong>er <strong>th</strong>an<br />
<strong>th</strong>at <strong>of</strong> <strong>th</strong>e bound EPS.<br />
4.5.5 Conductivity and TDS<br />
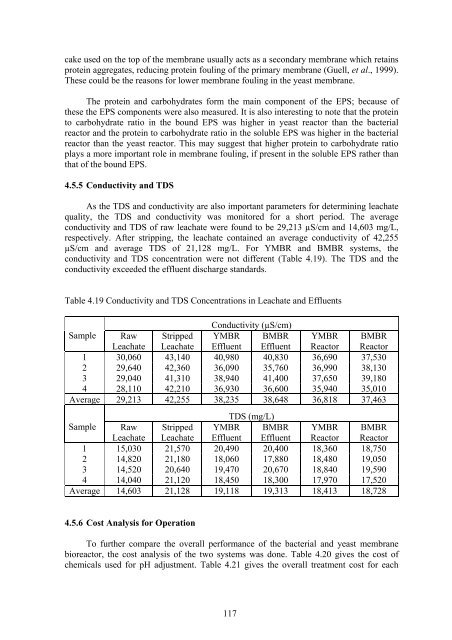
As <strong>th</strong>e TDS and conductivity are also important parameters for determining le<strong>ac</strong>hate<br />
quality, <strong>th</strong>e TDS and conductivity was monitored for a short period. The average<br />
conductivity and TDS <strong>of</strong> raw le<strong>ac</strong>hate were found to be 29,213 µS/cm and 14,603 mg/L,<br />
respectively. After stripping, <strong>th</strong>e le<strong>ac</strong>hate contained an average conductivity <strong>of</strong> 42,255<br />
µS/cm and average TDS <strong>of</strong> 21,128 mg/L. For YMBR and BMBR systems, <strong>th</strong>e<br />
conductivity and TDS concentration were not different (Table 4.19). The TDS and <strong>th</strong>e<br />
conductivity exceeded <strong>th</strong>e effluent discharge standards.<br />
Table 4.19 Conductivity and TDS Concentrations in Le<strong>ac</strong>hate and Effluents<br />
Conductivity (µS/cm)<br />
Sample Raw Stripped YMBR BMBR YMBR BMBR<br />
Le<strong>ac</strong>hate Le<strong>ac</strong>hate Effluent Effluent Re<strong>ac</strong>tor Re<strong>ac</strong>tor<br />
1 30,060 43,140 40,980 40,830 36,690 37,530<br />
2 29,640 42,360 36,090 35,760 36,990 38,130<br />
3 29,040 41,310 38,940 41,400 37,650 39,180<br />
4 28,110 42,210 36,930 36,600 35,940 35,010<br />
Average 29,213 42,255 38,235 38,648 36,818 37,463<br />
TDS (mg/L)<br />
Sample Raw Stripped YMBR BMBR YMBR BMBR<br />
Le<strong>ac</strong>hate Le<strong>ac</strong>hate Effluent Effluent Re<strong>ac</strong>tor Re<strong>ac</strong>tor<br />
1 15,030 21,570 20,490 20,400 18,360 18,750<br />
2 14,820 21,180 18,060 17,880 18,480 19,050<br />
3 14,520 20,640 19,470 20,670 18,840 19,590<br />
4 14,040 21,120 18,450 18,300 17,970 17,520<br />
Average 14,603 21,128 19,118 19,313 18,413 18,728<br />
4.5.6 Cost Analysis for Operation<br />
To fur<strong>th</strong>er compare <strong>th</strong>e overall performance <strong>of</strong> <strong>th</strong>e b<strong>ac</strong>terial and yeast membrane<br />
biore<strong>ac</strong>tor, <strong>th</strong>e cost analysis <strong>of</strong> <strong>th</strong>e two systems was done. Table 4.20 gives <strong>th</strong>e cost <strong>of</strong><br />
chemicals used for pH adjustment. Table 4.21 gives <strong>th</strong>e overall treatment cost for e<strong>ac</strong>h<br />
117


