

Thesis - faculty.ait.ac.th - Asian Institute of Technology
Thesis - faculty.ait.ac.th - Asian Institute of Technology
Thesis - faculty.ait.ac.th - Asian Institute of Technology

You also want an ePaper? Increase the reach of your titles
YUMPU automatically turns print PDFs into web optimized ePapers that Google loves.
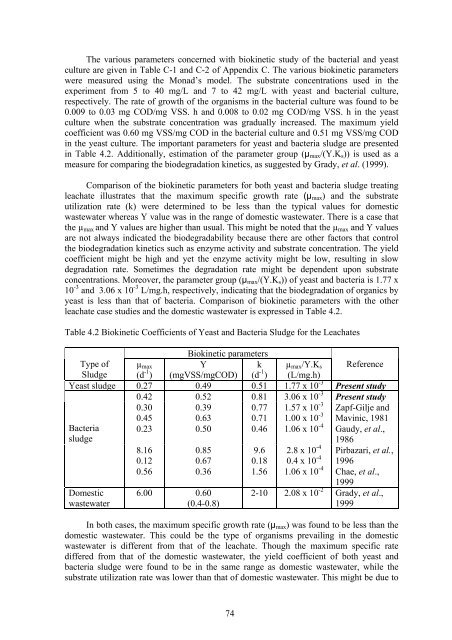
The various parameters concerned wi<strong>th</strong> biokinetic study <strong>of</strong> <strong>th</strong>e b<strong>ac</strong>terial and yeast<br />
culture are given in Table C-1 and C-2 <strong>of</strong> Appendix C. The various biokinetic parameters<br />
were measured using <strong>th</strong>e Monad’s model. The substrate concentrations used in <strong>th</strong>e<br />
experiment from 5 to 40 mg/L and 7 to 42 mg/L wi<strong>th</strong> yeast and b<strong>ac</strong>terial culture,<br />
respectively. The rate <strong>of</strong> grow<strong>th</strong> <strong>of</strong> <strong>th</strong>e organisms in <strong>th</strong>e b<strong>ac</strong>terial culture was found to be<br />
0.009 to 0.03 mg COD/mg VSS. h and 0.008 to 0.02 mg COD/mg VSS. h in <strong>th</strong>e yeast<br />
culture when <strong>th</strong>e substrate concentration was gradually increased. The maximum yield<br />
coefficient was 0.60 mg VSS/mg COD in <strong>th</strong>e b<strong>ac</strong>terial culture and 0.51 mg VSS/mg COD<br />
in <strong>th</strong>e yeast culture. The important parameters for yeast and b<strong>ac</strong>teria sludge are presented<br />
in Table 4.2. Additionally, estimation <strong>of</strong> <strong>th</strong>e parameter group (µmax/(Y.Ks)) is used as a<br />
measure for comparing <strong>th</strong>e biodegradation kinetics, as suggested by Grady, et al. (1999).<br />
Comparison <strong>of</strong> <strong>th</strong>e biokinetic parameters for bo<strong>th</strong> yeast and b<strong>ac</strong>teria sludge treating<br />
le<strong>ac</strong>hate illustrates <strong>th</strong>at <strong>th</strong>e maximum specific grow<strong>th</strong> rate (µmax) and <strong>th</strong>e substrate<br />
utilization rate (k) were determined to be less <strong>th</strong>an <strong>th</strong>e typical values for domestic<br />
wastewater whereas Y value was in <strong>th</strong>e range <strong>of</strong> domestic wastewater. There is a case <strong>th</strong>at<br />
<strong>th</strong>e µmax and Y values are higher <strong>th</strong>an usual. This might be noted <strong>th</strong>at <strong>th</strong>e µmax and Y values<br />
are not always indicated <strong>th</strong>e biodegradability because <strong>th</strong>ere are o<strong>th</strong>er f<strong>ac</strong>tors <strong>th</strong>at control<br />
<strong>th</strong>e biodegradation kinetics such as enzyme <strong>ac</strong>tivity and substrate concentration. The yield<br />
coefficient might be high and yet <strong>th</strong>e enzyme <strong>ac</strong>tivity might be low, resulting in slow<br />
degradation rate. Sometimes <strong>th</strong>e degradation rate might be dependent upon substrate<br />
concentrations. Moreover, <strong>th</strong>e parameter group (µmax/(Y.Ks)) <strong>of</strong> yeast and b<strong>ac</strong>teria is 1.77 x<br />
10 -3 and 3.06 x 10 -3 L/mg.h, respectively, indicating <strong>th</strong>at <strong>th</strong>e biodegradation <strong>of</strong> organics by<br />
yeast is less <strong>th</strong>an <strong>th</strong>at <strong>of</strong> b<strong>ac</strong>teria. Comparison <strong>of</strong> biokinetic parameters wi<strong>th</strong> <strong>th</strong>e o<strong>th</strong>er<br />
le<strong>ac</strong>hate case studies and <strong>th</strong>e domestic wastewater is expressed in Table 4.2.<br />
Table 4.2 Biokinetic Coefficients <strong>of</strong> Yeast and B<strong>ac</strong>teria Sludge for <strong>th</strong>e Le<strong>ac</strong>hates<br />
Biokinetic parameters<br />
Type <strong>of</strong><br />
Sludge<br />
µmax<br />
(d -1 )<br />
Y<br />
(mgVSS/mgCOD)<br />
k<br />
(d -1 )<br />
µmax/Y.Ks<br />
(L/mg.h)<br />
Reference<br />
Yeast sludge 0.27 0.49 0.51 1.77 x 10 -3 Present study<br />
0.42 0.52 0.81 3.06 x 10 -3 Present study<br />
0.30 0.39 0.77 1.57 x 10<br />
0.45 0.63 0.71<br />
-3<br />
1.00 x 10 -3<br />
Zapf-Gilje and<br />
Mavinic, 1981<br />
0.23 0.50 0.46 1.06 x 10 -4 Gaudy, et al.,<br />
1986<br />
8.16 0.85 9.6 2.8 x 10<br />
0.12 0.67 0.18<br />
-4<br />
0.4 x 10 -4<br />
B<strong>ac</strong>teria<br />
sludge<br />
Pirbazari, et al.,<br />
1996<br />
0.56 0.36 1.56 1.06 x 10 -4 Chae, et al.,<br />
1999<br />
Domestic 6.00 0.60 2-10 2.08 x 10<br />
wastewater<br />
(0.4-0.8)<br />
-2 Grady, et al.,<br />
1999<br />
In bo<strong>th</strong> cases, <strong>th</strong>e maximum specific grow<strong>th</strong> rate (µmax) was found to be less <strong>th</strong>an <strong>th</strong>e<br />
domestic wastewater. This could be <strong>th</strong>e type <strong>of</strong> organisms prevailing in <strong>th</strong>e domestic<br />
wastewater is different from <strong>th</strong>at <strong>of</strong> <strong>th</strong>e le<strong>ac</strong>hate. Though <strong>th</strong>e maximum specific rate<br />
differed from <strong>th</strong>at <strong>of</strong> <strong>th</strong>e domestic wastewater, <strong>th</strong>e yield coefficient <strong>of</strong> bo<strong>th</strong> yeast and<br />
b<strong>ac</strong>teria sludge were found to be in <strong>th</strong>e same range as domestic wastewater, while <strong>th</strong>e<br />
substrate utilization rate was lower <strong>th</strong>an <strong>th</strong>at <strong>of</strong> domestic wastewater. This might be due to<br />
74


