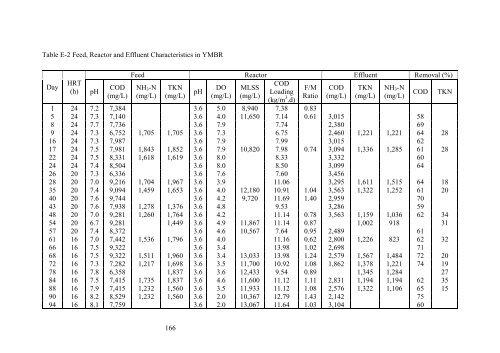
Table E-2 Feed, Re<strong>ac</strong>tor and Effluent Char<strong>ac</strong>teristics in YMBR Day HRT (h) pH COD (mg/L) Feed Re<strong>ac</strong>tor Effluent Removal (%) NH3-N (mg/L) TKN (mg/L) pH 166 DO (mg/L) MLSS (mg/L) COD Loading (kg/m 3 .d) F/M Ratio COD (mg/L) TKN (mg/L) NH3-N (mg/L) COD TKN 1 24 7.2 7,384 3.6 5.0 8,940 7.38 0.83 5 24 7.3 7,140 3.6 4.0 11,650 7.14 0.61 3,015 58 8 24 7.7 7,736 3.6 7.9 7.74 2,380 69 9 24 7.3 6,752 1,705 1,705 3.6 7.3 6.75 2,460 1,221 1,221 64 28 16 24 7.3 7,987 3.6 7.9 7.99 3,015 62 17 24 7.5 7,981 1,843 1,852 3.6 7.9 10,820 7.98 0.74 3,094 1,336 1,285 61 28 22 24 7.5 8,331 1,618 1,619 3.6 8.0 8.33 3,332 60 24 24 7.4 8,504 3.6 8.0 8.50 3,099 64 26 20 7.3 6,336 3.6 7.6 7.60 3,456 28 20 7.0 9,216 1,704 1,967 3.6 3.9 11.06 3,295 1,611 1,515 64 18 35 20 7.4 9,094 1,459 1,653 3.6 4.0 12,180 10.91 1.04 3,563 1,322 1,252 61 20 40 20 7.6 9,744 3.6 4.2 9,720 11.69 1.40 2,959 70 43 20 7.6 7,938 1,278 1,376 3.6 4.8 9.53 3,286 59 48 20 7.0 9,281 1,260 1,764 3.6 4.2 11.14 0.78 3,563 1,159 1,036 62 34 54 20 6.7 9,281 1,449 3.6 4.9 11,867 11.14 0.87 1,002 918 31 57 20 7.4 8,372 3.6 4.6 10,567 7.64 0.95 2,489 61 61 16 7.0 7,442 1,536 1,796 3.6 4.0 11.16 0.62 2,800 1,226 823 62 32 66 16 7.5 9,322 3.6 3.4 13.98 1.02 2,698 71 68 16 7.5 9,322 1,511 1,960 3.6 3.4 13,033 13.98 1.24 2,579 1,567 1,484 72 20 72 16 7.3 7,282 1,217 1,698 3.6 3.5 11,700 10.92 1.08 1,862 1,378 1,221 74 19 78 16 7.8 6,358 1,837 3.6 3.6 12,433 9.54 0.89 1,345 1,284 27 84 16 7.5 7,415 1,735 1,837 3.6 4.6 11,600 11.12 1.11 2,831 1,194 1,194 62 35 88 16 7.9 7,415 1,232 1,560 3.6 3.5 11,933 11.12 1.08 2,576 1,322 1,106 65 15 90 16 8.2 8,529 1,232 1,560 3.6 2.0 10,367 12.79 1.43 2,142 75 94 16 8.1 7,759 3.6 2.0 13,067 11.64 1.03 3,104 60
Day HRT (h) pH COD (mg/L) Feed Re<strong>ac</strong>tor Effluent Removal (%) NH3-N (mg/L) TKN (mg/L) pH 167 DO (mg/L) MLSS (mg/L) COD Loading (kg/m 3 .d) F/M Ratio COD (mg/L) TKN (mg/L) NH3-N (mg/L) COD TKN 104 16 8.5 8,662 3.6 3.3 10,000 12.99 1.51 3,176 63 107 16 8.7 8,662 1,796 3.6 4.6 12,600 12.99 1.20 3,409 1,279 1,176 61 29 117 16 8.7 9,600 3.6 4.9 11,367 14.40 1.47 3,757 61 119 16 8.2 6,957 2,045 2,253 3.6 3.7 12,333 10.43 0.98 2,769 1,440 818 60 36 124 16 8.4 8,735 1,691 2,145 3.6 4.7 9,533 13.10 1.59 2,470 1,389 1,221 72 35 130 16 8.2 7,938 1,778 2,156 3.6 3.5 12,700 11.91 1.09 1,985 1,482 1,110 75 31 136 16 7.4 7,938 1,106 1,613 3.6 4.8 11,367 11.91 1.22 2,483 69 141 16 7.4 7,759 1,613 3.6 3.2 12,700 11.64 1.06 3,070 1,313 60 19 148 16 8.2 7,646 1,854 3.6 5.2 10,233 15.29 1.49 2,146 72 150 12 7.9 8,938 2,066 3.6 3.5 10,900 17.88 1.64 3,320 1,581 1,358 63 23 157 12 8.2 8,000 1,831 2,013 3.6 0.4 11,867 16.00 1.35 3,231 60 160 12 8.5 8,566 2,093 3.6 6.9 10,833 17.13 1.58 4,273 1,798 1,610 50 11 164 12 8.1 7,344 1,540 1,837 3.6 2.5 11,567 14.69 1.27 3,515 1,456 1,331 52 15 169 12 8.0 7,077 1,590 1,876 3.6 6.1 11,867 14.15 1.19 3,385 1,504 1,352 52 20 173 12 8.1 7,076 1,562 1,848 3.6 2.6 11,900 14.15 1.19 3,038 1,512 1,361 57 18 176 12 8.1 7,050 1,604 1,893 3.6 3.2 13,533 14.10 1.04 3,300 1,599 1,375 53 16 179 12 8.1 7,077 1,649 1,960 3.6 6.7 10,600 10.62 1.16 2,769 1,576 1,369 61 20 181 12 8.2 6,962 1,607 1,893 3.6 3.9 11,867 10.44 1.02 3,231 54
- Page 1 and 2:
APPLICATION OF MEMBRANE BIOREACTOR
- Page 3 and 4:
Abstract Landfill leachate is a com
- Page 5 and 6:
Table of Contents Chapter Title Pag
- Page 7 and 8:
4.5.6 Cost Analysis for Operation 1
- Page 9 and 10:
4.4 Effect of Free Ammonia Concentr
- Page 11 and 12:
4.16 COD Concentration in the Influ
- Page 13 and 14:
MWCO Molecular Weight Cut-off MWW M
- Page 15 and 16:
1.1 Background Chapter 1 Introducti
- Page 17 and 18:
generally unsuccessful in removal o
- Page 19 and 20:
2.1 Introduction Chapter 2 Literatu
- Page 21 and 22:
In the municipal solid waste landfi
- Page 23 and 24:
COD/TOC, VS/FS and VFA/TOC ratios o
- Page 25 and 26:
Table 2.3 presents the general leac
- Page 27 and 28:
Ground water 2.7.1 Seasonal Variati
- Page 29 and 30:
Table 2.5 Variation of COD, BOD & B
- Page 31 and 32:
entails the re-circulation of leach
- Page 33 and 34:
Table 2.8 Summary of Biokinetic Coe
- Page 35 and 36:
that extensive loss of nitrogen (up
- Page 37 and 38:
ammonia could only be achieved when
- Page 39 and 40:
Table 2.10 Treatment Efficiencies o
- Page 41 and 42:
Activated Carbon Adsorption Granula
- Page 43 and 44:
Colloidal material as well as metal
- Page 45 and 46:
iologically, physical-chemical proc
- Page 47 and 48:
Ammonia Stripping Air stripping of
- Page 49 and 50:
These systems are land intensive wh
- Page 51 and 52:
the biological treatment can be rep
- Page 53 and 54:
Table 2.16 Typical Leachate Composi
- Page 55 and 56:
influent reached 200 mg/L. For the
- Page 57 and 58:
Table 2.18 Advantages and Disadvant
- Page 59 and 60:
through the effluent. Different ope
- Page 61 and 62:
Mixed Liquor Suspended Solids and D
- Page 63 and 64:
2.12 Yeasts 2.12.1 Introduction The
- Page 65 and 66:
Nishihara ESRC Ltd. (2001) studied
- Page 67 and 68:
nitrification-denitrification proce
- Page 69 and 70:
Table 3.1 Composition of Simulated
- Page 71 and 72:
3.4.1 Ammonia Toxicity The experime
- Page 73 and 74:
Figure 3.4 Experiments Conducted to
- Page 75 and 76:
Leachate Option Ammonia Stripping R
- Page 77 and 78:
MW larger than 50 kDa, (2) MW betwe
- Page 79 and 80:
Figure 3.7 Flowchart Showing Ammoni
- Page 81 and 82:
Chapter 4 Results and Discussion 4.
- Page 83 and 84:
COD Removal Effeciency (%) COD Remo
- Page 85 and 86:
MLSS (mg/L) 14000 12000 10000 8000
- Page 87 and 88:
Specific Growth Rate ( d -1 ) 0.50
- Page 89 and 90:
change in the predominant species w
- Page 91 and 92:
Table 4.4 Effect of Free Ammonia Co
- Page 93 and 94:
Table 4.5 Substrate Utilization by
- Page 95 and 96:
4.3.1 Initial Membrane Resistance P
- Page 97 and 98:
when compared with the present stud
- Page 99 and 100:
COD Removal Efficiency (%) 90 80 70
- Page 101 and 102:
(2) TKN Removal Efficiency Prior to
- Page 103 and 104:
As there was no significant improve
- Page 105 and 106:
The probable reason for frequent fo
- Page 107 and 108:
Ammonia Concentration (mg/L) Ammoni
- Page 109 and 110:
concentration after treatment. Othe
- Page 111 and 112:
After the chemical cleaning of the
- Page 113 and 114:
emoval of 38%. A higher removal in
- Page 115 and 116:
Influent BOD (mg/L) Influent BOD (m
- Page 117 and 118:
(3) TKN Removal Efficiency The TKN
- Page 119 and 120:
Figure 4.34 gives the overall TKN r
- Page 121 and 122:
fraction and slowly biodegradable C
- Page 123 and 124:
BOD (mg/L) BOD (mg/L) 6000 5000 400
- Page 125 and 126:
Figure 4.39 Molecular Weight Cut-of
- Page 127 and 128:
COD (mg/L) 8000 6000 4000 2000 COD
- Page 129 and 130: Though, the obtained COD removal ef
- Page 131 and 132: cake used on the top of the membran
- Page 133 and 134: Chapter 5 Conclusions and Recommend
- Page 135 and 136: 0.02, respectively. This can be con
- Page 137 and 138: References Abeling, U., and Seyfrie
- Page 139 and 140: Brown, M.J., and Lester, J.N., 1980
- Page 141 and 142: Diamadopoulos, E., 1994. Characteri
- Page 143 and 144: Grady, C.P.L., Daigger, G.T., and L
- Page 145 and 146: Keenan, J.D., Steiner, R.L., and Fu
- Page 147 and 148: Martin, G.M.A., Auzmenti, A.I., and
- Page 149 and 150: Pohland, F.G., and Harper, S.R., 19
- Page 151 and 152: Shin, H.S., An, H., Kang, S.T., Cho
- Page 153 and 154: Visvanathan, C., Ben Aim, R., and P
- Page 155 and 156: Appendix A Pictures of Experiments
- Page 157 and 158: Raw Leachate YMBR Effluent BMBR Eff
- Page 159 and 160: Appendix B Leachate Characteristics
- Page 161 and 162: Table B-2 Acclimation of Mixed Yeas
- Page 163 and 164: Appendix C Experimental Data of Bio
- Page 165 and 166: y: Where: OUR at line g: This is th
- Page 167 and 168: Table C-3 Experimental Results for
- Page 169 and 170: Appendix D Membrane Resistance Stud
- Page 171 and 172: Table D-3 Experimental Data for Det
- Page 173 and 174: Table D-4 Experimental Data for Det
- Page 175 and 176: Pressure (kPa) Pressure (kPa) 25 20
- Page 177 and 178: Appendix E MBR without Ammonia Stri
- Page 179: Day HRT (h) pH COD (mg/L) Feed Reac
- Page 183 and 184: Table E-3 Variation in TMP with Tim
- Page 185 and 186: Appendix F Ammonia Stripping Studie
- Page 187 and 188: Table F-5 Pilot Scale Study on Ammo
- Page 189 and 190: Table G-1 Feed, Reactor and Effluen
- Page 191 and 192: Table G-3 Feed, Reactor and Effluen
- Page 193 and 194: Appendix H Other Studies 179
- Page 195 and 196: Table H-2 Membrane Resistance of th
- Page 197: Table H-6 Chemical Cost for the Yea