

Thesis - faculty.ait.ac.th - Asian Institute of Technology
Thesis - faculty.ait.ac.th - Asian Institute of Technology
Thesis - faculty.ait.ac.th - Asian Institute of Technology

Create successful ePaper yourself
Turn your PDF publications into a flip-book with our unique Google optimized e-Paper software.
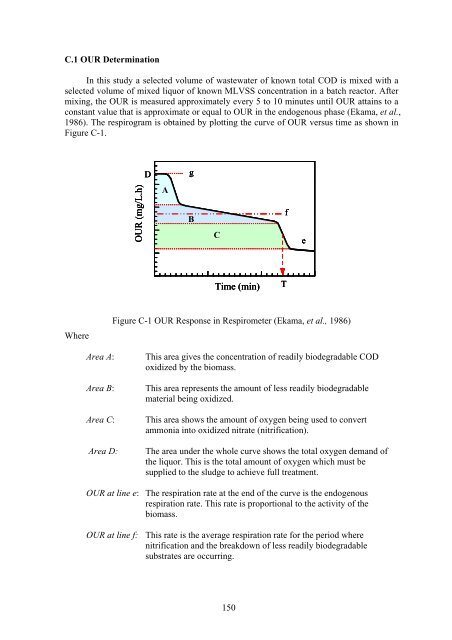
C.1 OUR Determination<br />
In <strong>th</strong>is study a selected volume <strong>of</strong> wastewater <strong>of</strong> known total COD is mixed wi<strong>th</strong> a<br />
selected volume <strong>of</strong> mixed liquor <strong>of</strong> known MLVSS concentration in a batch re<strong>ac</strong>tor. After<br />
mixing, <strong>th</strong>e OUR is measured approximately every 5 to 10 minutes until OUR attains to a<br />
constant value <strong>th</strong>at is approximate or equal to OUR in <strong>th</strong>e endogenous phase (Ekama, et al.,<br />
1986). The respirogram is obtained by plotting <strong>th</strong>e curve <strong>of</strong> OUR versus time as shown in<br />
Figure C-1.<br />
Where<br />
OUR (mg/L.h)<br />
D<br />
A<br />
g<br />
g<br />
B<br />
C<br />
Time (min)<br />
Figure C-1 OUR Response in Respirometer (Ekama, et al., 1986)<br />
Area A: This area gives <strong>th</strong>e concentration <strong>of</strong> readily biodegradable COD<br />
oxidized by <strong>th</strong>e biomass.<br />
Area B: This area represents <strong>th</strong>e amount <strong>of</strong> less readily biodegradable<br />
material being oxidized.<br />
Area C: This area shows <strong>th</strong>e amount <strong>of</strong> oxygen being used to convert<br />
ammonia into oxidized nitrate (nitrification).<br />
Area D: The area under <strong>th</strong>e whole curve shows <strong>th</strong>e total oxygen demand <strong>of</strong><br />
<strong>th</strong>e liquor. This is <strong>th</strong>e total amount <strong>of</strong> oxygen which must be<br />
supplied to <strong>th</strong>e sludge to <strong>ac</strong>hieve full treatment.<br />
OUR at line e: The respiration rate at <strong>th</strong>e end <strong>of</strong> <strong>th</strong>e curve is <strong>th</strong>e endogenous<br />
respiration rate. This rate is proportional to <strong>th</strong>e <strong>ac</strong>tivity <strong>of</strong> <strong>th</strong>e<br />
biomass.<br />
OUR at line f: This rate is <strong>th</strong>e average respiration rate for <strong>th</strong>e period where<br />
nitrification and <strong>th</strong>e breakdown <strong>of</strong> less readily biodegradable<br />
substrates are occurring.<br />
150<br />
f<br />
T<br />
e<br />
e


