Effectiveness and Economic Impact of Tax Incentives in the SADC ...
Effectiveness and Economic Impact of Tax Incentives in the SADC ...
Effectiveness and Economic Impact of Tax Incentives in the SADC ...

You also want an ePaper? Increase the reach of your titles
YUMPU automatically turns print PDFs into web optimized ePapers that Google loves.
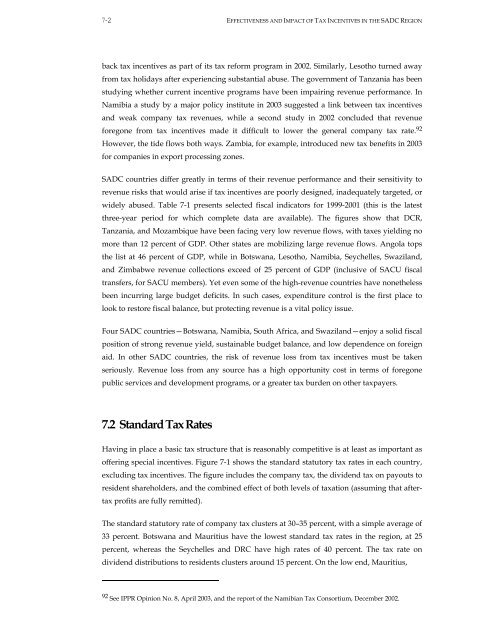
7-2 EFFECTIVENESS AND IMPACT OF TAX INCENTIVES IN THE <strong>SADC</strong> REGION<br />
back tax <strong>in</strong>centives as part <strong>of</strong> its tax reform program <strong>in</strong> 2002. Similarly, Lesotho turned away<br />
from tax holidays after experienc<strong>in</strong>g substantial abuse. The government <strong>of</strong> Tanzania has been<br />
study<strong>in</strong>g whe<strong>the</strong>r current <strong>in</strong>centive programs have been impair<strong>in</strong>g revenue performance. In<br />
Namibia a study by a major policy <strong>in</strong>stitute <strong>in</strong> 2003 suggested a l<strong>in</strong>k between tax <strong>in</strong>centives<br />
<strong>and</strong> weak company tax revenues, while a second study <strong>in</strong> 2002 concluded that revenue<br />
foregone from tax <strong>in</strong>centives made it difficult to lower <strong>the</strong> general company tax rate. 92<br />
However, <strong>the</strong> tide flows both ways. Zambia, for example, <strong>in</strong>troduced new tax benefits <strong>in</strong> 2003<br />
for companies <strong>in</strong> export process<strong>in</strong>g zones.<br />
<strong>SADC</strong> countries differ greatly <strong>in</strong> terms <strong>of</strong> <strong>the</strong>ir revenue performance <strong>and</strong> <strong>the</strong>ir sensitivity to<br />
revenue risks that would arise if tax <strong>in</strong>centives are poorly designed, <strong>in</strong>adequately targeted, or<br />
widely abused. Table 7-1 presents selected fiscal <strong>in</strong>dicators for 1999-2001 (this is <strong>the</strong> latest<br />
three-year period for which complete data are available). The figures show that DCR,<br />
Tanzania, <strong>and</strong> Mozambique have been fac<strong>in</strong>g very low revenue flows, with taxes yield<strong>in</strong>g no<br />
more than 12 percent <strong>of</strong> GDP. O<strong>the</strong>r states are mobiliz<strong>in</strong>g large revenue flows. Angola tops<br />
<strong>the</strong> list at 46 percent <strong>of</strong> GDP, while <strong>in</strong> Botswana, Lesotho, Namibia, Seychelles, Swazil<strong>and</strong>,<br />
<strong>and</strong> Zimbabwe revenue collections exceed <strong>of</strong> 25 percent <strong>of</strong> GDP (<strong>in</strong>clusive <strong>of</strong> SACU fiscal<br />
transfers, for SACU members). Yet even some <strong>of</strong> <strong>the</strong> high-revenue countries have none<strong>the</strong>less<br />
been <strong>in</strong>curr<strong>in</strong>g large budget deficits. In such cases, expenditure control is <strong>the</strong> first place to<br />
look to restore fiscal balance, but protect<strong>in</strong>g revenue is a vital policy issue.<br />
Four <strong>SADC</strong> countries—Botswana, Namibia, South Africa, <strong>and</strong> Swazil<strong>and</strong>—enjoy a solid fiscal<br />
position <strong>of</strong> strong revenue yield, susta<strong>in</strong>able budget balance, <strong>and</strong> low dependence on foreign<br />
aid. In o<strong>the</strong>r <strong>SADC</strong> countries, <strong>the</strong> risk <strong>of</strong> revenue loss from tax <strong>in</strong>centives must be taken<br />
seriously. Revenue loss from any source has a high opportunity cost <strong>in</strong> terms <strong>of</strong> foregone<br />
public services <strong>and</strong> development programs, or a greater tax burden on o<strong>the</strong>r taxpayers.<br />
7.2 St<strong>and</strong>ard <strong>Tax</strong> Rates<br />
Hav<strong>in</strong>g <strong>in</strong> place a basic tax structure that is reasonably competitive is at least as important as<br />
<strong>of</strong>fer<strong>in</strong>g special <strong>in</strong>centives. Figure 7-1 shows <strong>the</strong> st<strong>and</strong>ard statutory tax rates <strong>in</strong> each country,<br />
exclud<strong>in</strong>g tax <strong>in</strong>centives. The figure <strong>in</strong>cludes <strong>the</strong> company tax, <strong>the</strong> dividend tax on payouts to<br />
resident shareholders, <strong>and</strong> <strong>the</strong> comb<strong>in</strong>ed effect <strong>of</strong> both levels <strong>of</strong> taxation (assum<strong>in</strong>g that after-<br />
tax pr<strong>of</strong>its are fully remitted).<br />
The st<strong>and</strong>ard statutory rate <strong>of</strong> company tax clusters at 30–35 percent, with a simple average <strong>of</strong><br />
33 percent. Botswana <strong>and</strong> Mauritius have <strong>the</strong> lowest st<strong>and</strong>ard tax rates <strong>in</strong> <strong>the</strong> region, at 25<br />
percent, whereas <strong>the</strong> Seychelles <strong>and</strong> DRC have high rates <strong>of</strong> 40 percent. The tax rate on<br />
dividend distributions to residents clusters around 15 percent. On <strong>the</strong> low end, Mauritius,<br />
92 See IPPR Op<strong>in</strong>ion No. 8, April 2003, <strong>and</strong> <strong>the</strong> report <strong>of</strong> <strong>the</strong> Namibian <strong>Tax</strong> Consortium, December 2002.