Effectiveness and Economic Impact of Tax Incentives in the SADC ...
Effectiveness and Economic Impact of Tax Incentives in the SADC ...
Effectiveness and Economic Impact of Tax Incentives in the SADC ...

You also want an ePaper? Increase the reach of your titles
YUMPU automatically turns print PDFs into web optimized ePapers that Google loves.
7-16 EFFECTIVENESS AND IMPACT OF TAX INCENTIVES IN THE <strong>SADC</strong> REGION<br />
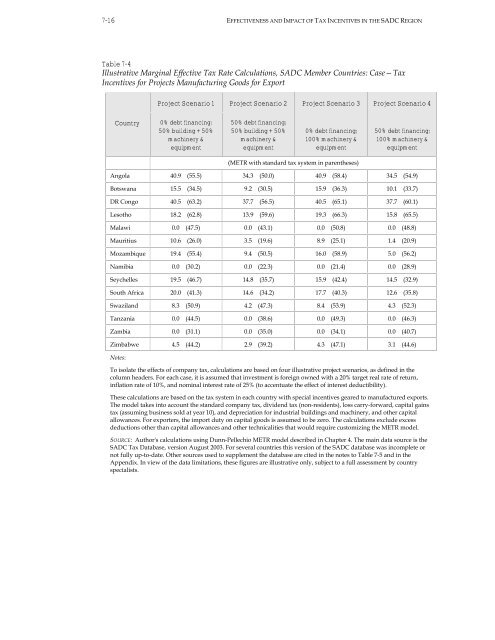
Table 7-4<br />
Illustrative Marg<strong>in</strong>al Effective <strong>Tax</strong> Rate Calculations, <strong>SADC</strong> Member Countries: Case—<strong>Tax</strong><br />
<strong>Incentives</strong> for Projects Manufactur<strong>in</strong>g Goods for Export<br />
Country<br />
Project Scenario 1 Project Scenario 2 Project Scenario 3 Project Scenario 4<br />
0% debt f<strong>in</strong>anc<strong>in</strong>g;<br />
50% build<strong>in</strong>g + 50%<br />
mach<strong>in</strong>ery &<br />
equipment<br />
50% debt f<strong>in</strong>anc<strong>in</strong>g;<br />
50% build<strong>in</strong>g + 50%<br />
mach<strong>in</strong>ery &<br />
equipment<br />
0% debt f<strong>in</strong>anc<strong>in</strong>g;<br />
100% mach<strong>in</strong>ery &<br />
equipment<br />
(METR with st<strong>and</strong>ard tax system <strong>in</strong> paren<strong>the</strong>ses)<br />
50% debt f<strong>in</strong>anc<strong>in</strong>g;<br />
100% mach<strong>in</strong>ery &<br />
equipment<br />
Angola 40.9 (55.5) 34.3 (50.0) 40.9 (58.4) 34.5 (54.9)<br />
Botswana 15.5 (34.5) 9.2 (30.5) 15.9 (36.3) 10.1 (33.7)<br />
DR Congo 40.5 (63.2) 37.7 (56.5) 40.5 (65.1) 37.7 (60.1)<br />
Lesotho 18.2 (62.8) 13.9 (59.6) 19.3 (66.3) 15.8 (65.5)<br />
Malawi 0.0 (47.5) 0.0 (43.1) 0.0 (50.8) 0.0 (48.8)<br />
Mauritius 10.6 (26.0) 3.5 (19.6) 8.9 (25.1) 1.4 (20.9)<br />
Mozambique 19.4 (55.4) 9.4 (50.5) 16.0 (58.9) 5.0 (56.2)<br />
Namibia 0.0 (30.2) 0.0 (22.3) 0.0 (21.4) 0.0 (28.9)<br />
Seychelles 19.5 (46.7) 14.8 (35.7) 15.9 (42.4) 14.5 (32.9)<br />
South Africa 20.0 (41.3) 14.6 (34.2) 17.7 (40.3) 12.6 (35.8)<br />
Swazil<strong>and</strong> 8.3 (50.9) 4.2 (47.3) 8.4 (53.9) 4.3 (52.3)<br />
Tanzania 0.0 (44.5) 0.0 (38.6) 0.0 (49.3) 0.0 (46.3)<br />
Zambia 0.0 (31.1) 0.0 (35.0) 0.0 (34.1) 0.0 (40.7)<br />
Zimbabwe 4.5 (44.2) 2.9 (39.2) 4.3 (47.1) 3.1 (44.6)<br />
Notes:<br />
To isolate <strong>the</strong> effects <strong>of</strong> company tax, calculations are based on four illustrative project scenarios, as def<strong>in</strong>ed <strong>in</strong> <strong>the</strong><br />
column headers. For each case, it is assumed that <strong>in</strong>vestment is foreign owned with a 20% target real rate <strong>of</strong> return,<br />
<strong>in</strong>flation rate <strong>of</strong> 10%, <strong>and</strong> nom<strong>in</strong>al <strong>in</strong>terest rate <strong>of</strong> 25% (to accentuate <strong>the</strong> effect <strong>of</strong> <strong>in</strong>terest deductibility).<br />
These calculations are based on <strong>the</strong> tax system <strong>in</strong> each country with special <strong>in</strong>centives geared to manufactured exports.<br />
The model takes <strong>in</strong>to account <strong>the</strong> st<strong>and</strong>ard company tax, dividend tax (non-residents), loss carry-forward, capital ga<strong>in</strong>s<br />
tax (assum<strong>in</strong>g bus<strong>in</strong>ess sold at year 10), <strong>and</strong> depreciation for <strong>in</strong>dustrial build<strong>in</strong>gs <strong>and</strong> mach<strong>in</strong>ery, <strong>and</strong> o<strong>the</strong>r capital<br />
allowances. For exporters, <strong>the</strong> import duty on capital goods is assumed to be zero. The calculations exclude excess<br />
deductions o<strong>the</strong>r than capital allowances <strong>and</strong> o<strong>the</strong>r technicalities that would require customiz<strong>in</strong>g <strong>the</strong> METR model.<br />
SOURCE: Author's calculations us<strong>in</strong>g Dunn-Pellechio METR model described <strong>in</strong> Chapter 4. The ma<strong>in</strong> data source is <strong>the</strong><br />
<strong>SADC</strong> <strong>Tax</strong> Database, version August 2003. For several countries this version <strong>of</strong> <strong>the</strong> <strong>SADC</strong> database was <strong>in</strong>complete or<br />
not fully up-to-date. O<strong>the</strong>r sources used to supplement <strong>the</strong> database are cited <strong>in</strong> <strong>the</strong> notes to Table 7-5 <strong>and</strong> <strong>in</strong> <strong>the</strong><br />
Appendix. In view <strong>of</strong> <strong>the</strong> data limitations, <strong>the</strong>se figures are illustrative only, subject to a full assessment by country<br />
specialists.