Effectiveness and Economic Impact of Tax Incentives in the SADC ...
Effectiveness and Economic Impact of Tax Incentives in the SADC ...
Effectiveness and Economic Impact of Tax Incentives in the SADC ...

You also want an ePaper? Increase the reach of your titles
YUMPU automatically turns print PDFs into web optimized ePapers that Google loves.
4-6 EFFECTIVENESS AND IMPACT OF TAX INCENTIVES IN THE <strong>SADC</strong> REGION<br />
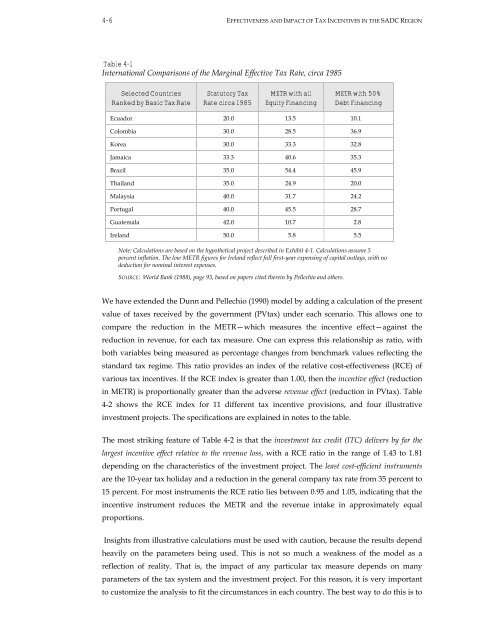
Table 4-1<br />
International Comparisons <strong>of</strong> <strong>the</strong> Marg<strong>in</strong>al Effective <strong>Tax</strong> Rate, circa 1985<br />
Selected Countries<br />
Ranked by Basic <strong>Tax</strong> Rate<br />
Statutory <strong>Tax</strong><br />
Rate circa 1985<br />
METR with all<br />
Equity F<strong>in</strong>anc<strong>in</strong>g<br />
METR with 50%<br />
Debt F<strong>in</strong>anc<strong>in</strong>g<br />
Ecuador 20.0 13.5 10.1<br />
Colombia 30.0 28.5 36.9<br />
Korea 30.0 33.3 32.8<br />
Jamaica 33.3 40.6 35.3<br />
Brazil 35.0 54.4 45.9<br />
Thail<strong>and</strong> 35.0 24.9 20.0<br />
Malaysia 40.0 31.7 24.2<br />
Portugal 40.0 45.5 28.7<br />
Guatemala 42.0 10.7 2.8<br />
Irel<strong>and</strong> 50.0 5.8 5.5<br />
Note: Calculations are based on <strong>the</strong> hypo<strong>the</strong>tical project described <strong>in</strong> Exhibit 4-1. Calculations assume 5<br />
percent <strong>in</strong>flation. The low METR figures for Irel<strong>and</strong> reflect full first-year expens<strong>in</strong>g <strong>of</strong> capital outlays, with no<br />
deduction for nom<strong>in</strong>al <strong>in</strong>terest expenses.<br />
SOURCE: World Bank (1988), page 93, based on papers cited <strong>the</strong>re<strong>in</strong> by Pellechio <strong>and</strong> o<strong>the</strong>rs.<br />
We have extended <strong>the</strong> Dunn <strong>and</strong> Pellechio (1990) model by add<strong>in</strong>g a calculation <strong>of</strong> <strong>the</strong> present<br />
value <strong>of</strong> taxes received by <strong>the</strong> government (PVtax) under each scenario. This allows one to<br />
compare <strong>the</strong> reduction <strong>in</strong> <strong>the</strong> METR—which measures <strong>the</strong> <strong>in</strong>centive effect—aga<strong>in</strong>st <strong>the</strong><br />
reduction <strong>in</strong> revenue, for each tax measure. One can express this relationship as ratio, with<br />
both variables be<strong>in</strong>g measured as percentage changes from benchmark values reflect<strong>in</strong>g <strong>the</strong><br />
st<strong>and</strong>ard tax regime. This ratio provides an <strong>in</strong>dex <strong>of</strong> <strong>the</strong> relative cost-effectiveness (RCE) <strong>of</strong><br />
various tax <strong>in</strong>centives. If <strong>the</strong> RCE <strong>in</strong>dex is greater than 1.00, <strong>the</strong>n <strong>the</strong> <strong>in</strong>centive effect (reduction<br />
<strong>in</strong> METR) is proportionally greater than <strong>the</strong> adverse revenue effect (reduction <strong>in</strong> PVtax). Table<br />
4-2 shows <strong>the</strong> RCE <strong>in</strong>dex for 11 different tax <strong>in</strong>centive provisions, <strong>and</strong> four illustrative<br />
<strong>in</strong>vestment projects. The specifications are expla<strong>in</strong>ed <strong>in</strong> notes to <strong>the</strong> table.<br />
The most strik<strong>in</strong>g feature <strong>of</strong> Table 4-2 is that <strong>the</strong> <strong>in</strong>vestment tax credit (ITC) delivers by far <strong>the</strong><br />
largest <strong>in</strong>centive effect relative to <strong>the</strong> revenue loss, with a RCE ratio <strong>in</strong> <strong>the</strong> range <strong>of</strong> 1.43 to 1.81<br />
depend<strong>in</strong>g on <strong>the</strong> characteristics <strong>of</strong> <strong>the</strong> <strong>in</strong>vestment project. The least cost-efficient <strong>in</strong>struments<br />
are <strong>the</strong> 10-year tax holiday <strong>and</strong> a reduction <strong>in</strong> <strong>the</strong> general company tax rate from 35 percent to<br />
15 percent. For most <strong>in</strong>struments <strong>the</strong> RCE ratio lies between 0.95 <strong>and</strong> 1.05, <strong>in</strong>dicat<strong>in</strong>g that <strong>the</strong><br />
<strong>in</strong>centive <strong>in</strong>strument reduces <strong>the</strong> METR <strong>and</strong> <strong>the</strong> revenue <strong>in</strong>take <strong>in</strong> approximately equal<br />
proportions.<br />
Insights from illustrative calculations must be used with caution, because <strong>the</strong> results depend<br />
heavily on <strong>the</strong> parameters be<strong>in</strong>g used. This is not so much a weakness <strong>of</strong> <strong>the</strong> model as a<br />
reflection <strong>of</strong> reality. That is, <strong>the</strong> impact <strong>of</strong> any particular tax measure depends on many<br />
parameters <strong>of</strong> <strong>the</strong> tax system <strong>and</strong> <strong>the</strong> <strong>in</strong>vestment project. For this reason, it is very important<br />
to customize <strong>the</strong> analysis to fit <strong>the</strong> circumstances <strong>in</strong> each country. The best way to do this is to