Effectiveness and Economic Impact of Tax Incentives in the SADC ...
Effectiveness and Economic Impact of Tax Incentives in the SADC ...
Effectiveness and Economic Impact of Tax Incentives in the SADC ...
Create successful ePaper yourself
Turn your PDF publications into a flip-book with our unique Google optimized e-Paper software.
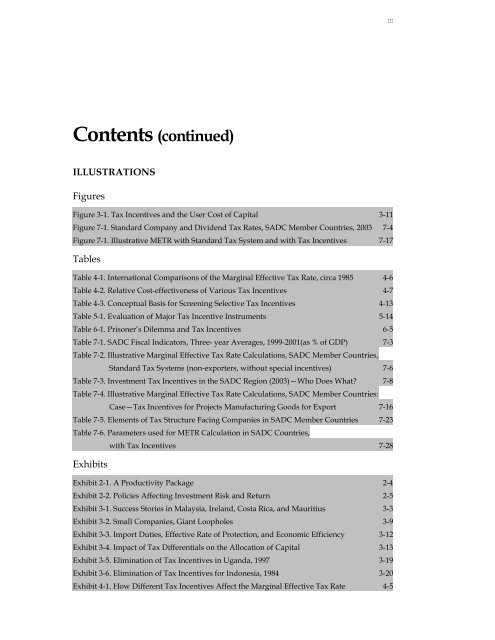
Contents (cont<strong>in</strong>ued)<br />
ILLUSTRATIONS<br />
Figures<br />
Figure 3-1. <strong>Tax</strong> <strong>Incentives</strong> <strong>and</strong> <strong>the</strong> User Cost <strong>of</strong> Capital 3-11<br />
Figure 7-1. St<strong>and</strong>ard Company <strong>and</strong> Dividend <strong>Tax</strong> Rates, <strong>SADC</strong> Member Countries, 2003 7-4<br />
Figure 7-1. Illustrative METR with St<strong>and</strong>ard <strong>Tax</strong> System <strong>and</strong> with <strong>Tax</strong> <strong>Incentives</strong> 7-17<br />
Tables<br />
Table 4-1. International Comparisons <strong>of</strong> <strong>the</strong> Marg<strong>in</strong>al Effective <strong>Tax</strong> Rate, circa 1985 4-6<br />
Table 4-2. Relative Cost-effectiveness <strong>of</strong> Various <strong>Tax</strong> <strong>Incentives</strong> 4-7<br />
Table 4-3. Conceptual Basis for Screen<strong>in</strong>g Selective <strong>Tax</strong> <strong>Incentives</strong> 4-13<br />
Table 5-1. Evaluation <strong>of</strong> Major <strong>Tax</strong> Incentive Instruments 5-14<br />
Table 6-1. Prisoner’s Dilemma <strong>and</strong> <strong>Tax</strong> <strong>Incentives</strong> 6-5<br />
Table 7-1. <strong>SADC</strong> Fiscal Indicators, Three- year Averages, 1999-2001(as % <strong>of</strong> GDP) 7-3<br />
Table 7-2. Illustrative Marg<strong>in</strong>al Effective <strong>Tax</strong> Rate Calculations, <strong>SADC</strong> Member Countries,<br />
St<strong>and</strong>ard <strong>Tax</strong> Systems (non-exporters, without special <strong>in</strong>centives) 7-6<br />
Table 7-3. Investment <strong>Tax</strong> <strong>Incentives</strong> <strong>in</strong> <strong>the</strong> <strong>SADC</strong> Region (2003)—Who Does What? 7-8<br />
Table 7-4. Illustrative Marg<strong>in</strong>al Effective <strong>Tax</strong> Rate Calculations, <strong>SADC</strong> Member Countries:<br />
Case—<strong>Tax</strong> <strong>Incentives</strong> for Projects Manufactur<strong>in</strong>g Goods for Export 7-16<br />
Table 7-5. Elements <strong>of</strong> <strong>Tax</strong> Structure Fac<strong>in</strong>g Companies <strong>in</strong> <strong>SADC</strong> Member Countries 7-23<br />
Table 7-6. Parameters used for METR Calculation <strong>in</strong> <strong>SADC</strong> Countries,<br />
Exhibits<br />
with <strong>Tax</strong> <strong>Incentives</strong> 7-28<br />
Exhibit 2-1. A Productivity Package 2-4<br />
Exhibit 2-2. Policies Affect<strong>in</strong>g Investment Risk <strong>and</strong> Return 2-5<br />
Exhibit 3-1. Success Stories <strong>in</strong> Malaysia, Irel<strong>and</strong>, Costa Rica, <strong>and</strong> Mauritius 3-3<br />
Exhibit 3-2. Small Companies, Giant Loopholes 3-9<br />
Exhibit 3-3. Import Duties, Effective Rate <strong>of</strong> Protection, <strong>and</strong> <strong>Economic</strong> Efficiency 3-12<br />
Exhibit 3-4. <strong>Impact</strong> <strong>of</strong> <strong>Tax</strong> Differentials on <strong>the</strong> Allocation <strong>of</strong> Capital 3-13<br />
Exhibit 3-5. Elim<strong>in</strong>ation <strong>of</strong> <strong>Tax</strong> <strong>Incentives</strong> <strong>in</strong> Ug<strong>and</strong>a, 1997 3-19<br />
Exhibit 3-6. Elim<strong>in</strong>ation <strong>of</strong> <strong>Tax</strong> <strong>Incentives</strong> for Indonesia, 1984 3-20<br />
Exhibit 4-1. How Different <strong>Tax</strong> <strong>Incentives</strong> Affect <strong>the</strong> Marg<strong>in</strong>al Effective <strong>Tax</strong> Rate 4-5<br />
III


