Download the file. - Groupe Seb
Download the file. - Groupe Seb
Download the file. - Groupe Seb

Create successful ePaper yourself
Turn your PDF publications into a flip-book with our unique Google optimized e-Paper software.
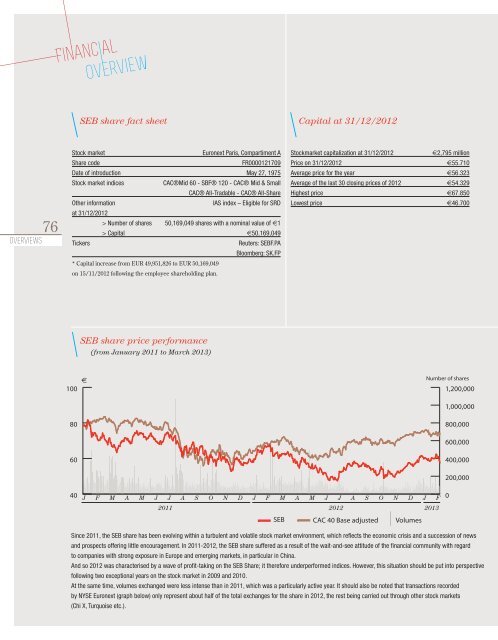
SEB share fact sheet<br />
Capital at 31/12/2012<br />
76<br />
overviews<br />
Stock market<br />
Euronext Paris, Compartiment A<br />
Share code<br />
FR0000121709<br />
Date of introduction May 27, 1975<br />
Stock market indices<br />
CAC®Mid 60 - SBF® 120 - CAC® Mid & Small<br />
CAC® All-Tradable - CAC® All-Share<br />
O<strong>the</strong>r information<br />
IAS index – Eligible for SRD<br />
at 31/12/2012<br />
> Number of shares 50,169,049 shares with a nominal value of €1<br />
> Capital €50,169,049<br />
Tickers<br />
Reuters: SEBF.PA<br />
Bloomberg: SK.FP<br />
* Capital increase from EUR 49,951,826 to EUR 50,169,049<br />
on 15/11/2012 following <strong>the</strong> employee shareholding plan.<br />
Stockmarket capitalization at 31/12/2012<br />
€2,795 million<br />
Price on 31/12/2012 €55.710<br />
Average price for <strong>the</strong> year €56.323<br />
Average of <strong>the</strong> last 30 closing prices of 2012 €54.329<br />
Highest price €67.850<br />
Lowest price €46.700<br />
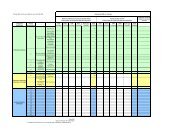
SEB share price performance<br />
(from January 2011 to March 2013)<br />
100<br />
€<br />
Number of shares<br />
1,200,000<br />
1,000,000<br />
80<br />
800,000<br />
600,000<br />
60<br />
400,000<br />
200,000<br />
40<br />
J F M A M J J A S O N D J F M A M J J A S O N D J F<br />
2011 2012 2013<br />
SEB CAC 40 Base adjusted Volumes<br />
0<br />
Since 2011, <strong>the</strong> SEB share has been evolving within a turbulent and volatile stock market environment, which reflects <strong>the</strong> economic crisis and a succession of news<br />
and prospects offering little encouragement. In 2011-2012, <strong>the</strong> SEB share suffered as a result of <strong>the</strong> wait-and-see attitude of <strong>the</strong> financial community with regard<br />
to companies with strong exposure in Europe and emerging markets, in particular in China.<br />
And so 2012 was characterised by a wave of profit-taking on <strong>the</strong> SEB Share; it <strong>the</strong>refore underperformed indices. However, this situation should be put into perspective<br />
following two exceptional years on <strong>the</strong> stock market in 2009 and 2010.<br />
At <strong>the</strong> same time, volumes exchanged were less intense than in 2011, which was a particularly active year. It should also be noted that transactions recorded<br />
by NYSE Euronext (graph below) only represent about half of <strong>the</strong> total exchanges for <strong>the</strong> share in 2012, <strong>the</strong> rest being carried out through o<strong>the</strong>r stock markets<br />
(Chi X, Turquoise etc.).