Download the file. - Groupe Seb
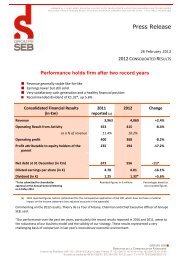
Download the file. - Groupe Seb
Download the file. - Groupe Seb

Create successful ePaper yourself
Turn your PDF publications into a flip-book with our unique Google optimized e-Paper software.
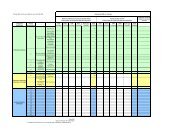
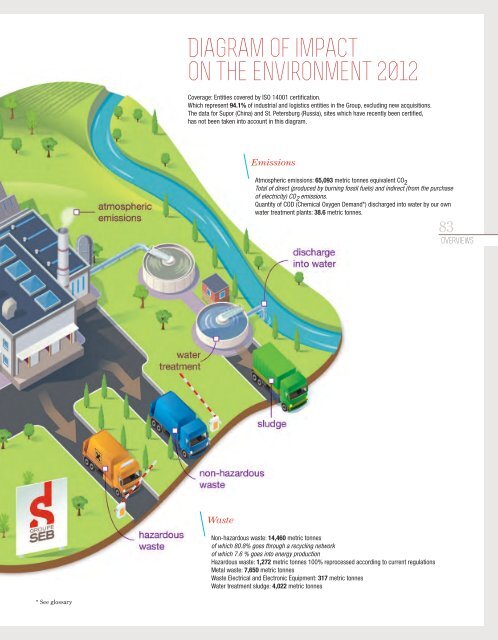
Diagram of impact<br />
on <strong>the</strong> environment 2012<br />
Coverage: Entities covered by ISO 14001 certification.<br />
Which represent 94.1% of industrial and logistics entities in <strong>the</strong> Group, excluding new acquisitions.<br />
The data for Supor (China) and St. Petersburg (Russia), sites which have recently been certified,<br />
has not been taken into account in this diagram.<br />
Emissions<br />
Atmospheric emissions: 65,093 metric tonnes equivalent CO 2<br />
Total of direct (produced by burning fossil fuels) and indirect (from <strong>the</strong> purchase<br />
of electricity) CO 2 emissions.<br />
Quantity of COD (Chemical Oxygen Demand*) discharged into water by our own<br />
water treatment plants: 38.6 metric tonnes.<br />
83<br />
overviews<br />
Waste<br />
Non-hazardous waste: 14,460 metric tonnes<br />
of which 80.8% goes through a recycling network<br />
of which 7.6 % goes into energy production<br />
Hazardous waste: 1,272 metric tonnes 100% reprocessed according to current regulations<br />
Metal waste: 7,650 metric tonnes<br />
Waste Electrical and Electronic Equipment: 317 metric tonnes<br />
Water treatment sludge: 4,022 metric tonnes<br />
* See glossary