Download the file. - Groupe Seb
Download the file. - Groupe Seb
Download the file. - Groupe Seb
Create successful ePaper yourself
Turn your PDF publications into a flip-book with our unique Google optimized e-Paper software.
TransporT-relaTed Co2 emissions<br />
The carbon footprint linked with <strong>the</strong> transport of products, raw<br />
materials and components was estimated at 216,551 metric<br />
tonnes equivalent CO2 for 2012. This has <strong>the</strong>refore decreased in<br />
relation to 2011 (-13 %), in spite of <strong>the</strong> increase in turnover. This<br />
data covers a worldwide range, excluding Maharaja Whiteline.<br />
82<br />
overviews<br />
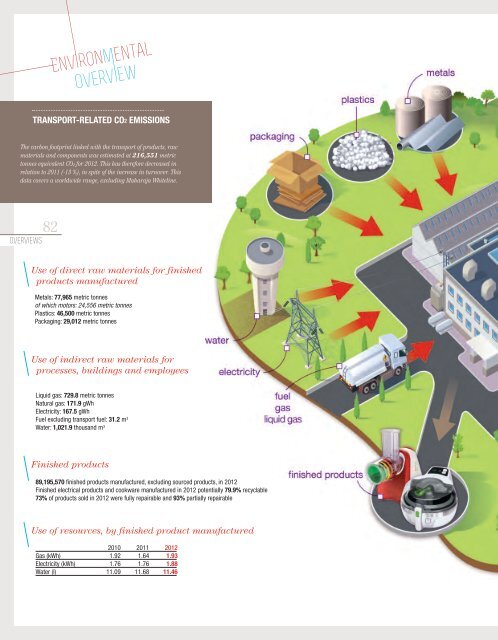
Use of direct raw materials for finished<br />
products manufactured<br />
Metals: 77,965 metric tonnes<br />
of which motors: 24,556 metric tonnes<br />
Plastics: 46,500 metric tonnes<br />
Packaging: 29,012 metric tonnes<br />
Use of indirect raw materials for<br />
processes, buildings and employees<br />
Liquid gas: 729.8 metric tonnes<br />
Natural gas: 171.9 gWh<br />
Electricity: 167.5 gWh<br />
Fuel excluding transport fuel: 31.2 m 3<br />
Water: 1,021.9 thousand m 3<br />
Finished products<br />
89,195,570 finished products manufactured, excluding sourced products, in 2012<br />
Finished electrical products and cookware manufactured in 2012 potentially 79.9% recyclable<br />
73% of products sold in 2012 were fully repairable and 93% partially repairable<br />
Use of resources, by finished product manufactured<br />
Gas (kWh)<br />
Electricity (kWh)<br />
Water (l)<br />
2010<br />
1.92<br />
1.76<br />
11.09<br />
2011<br />
1.64<br />
1.76<br />
11.68<br />
2012<br />
1.93<br />
1.88<br />
11.46


