Download the file. - Groupe Seb
Download the file. - Groupe Seb
Download the file. - Groupe Seb

You also want an ePaper? Increase the reach of your titles
YUMPU automatically turns print PDFs into web optimized ePapers that Google loves.
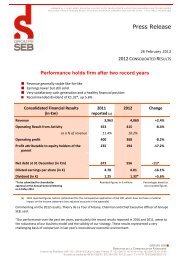
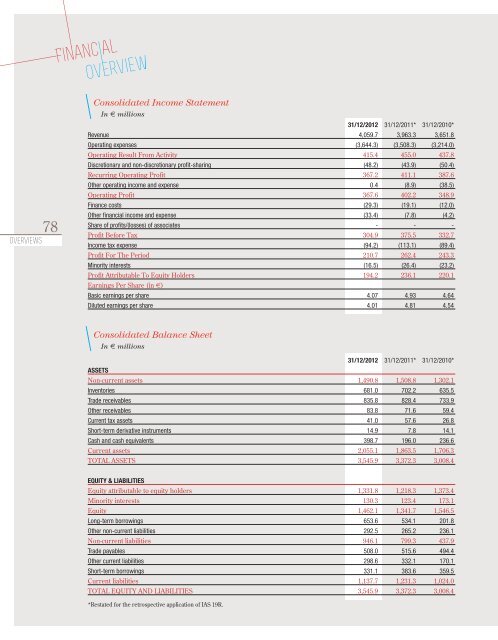
Consolidated Income Statement<br />
In € millions<br />
31/12/2012<br />
31/12/2011*<br />
31/12/2010*<br />
Revenue<br />
4,059.7<br />
3,963.3<br />
3,651.8<br />
Operating expenses<br />
(3,644.3)<br />
(3,508.3)<br />
(3,214.0)<br />
Operating Result From Activity<br />
415.4<br />
455.0<br />
437.8<br />
Discretionary and non-discretionary profit-sharing<br />
(48.2)<br />
(43.9)<br />
(50.4)<br />
Recurring Operating Profit<br />
367.2<br />
411.1<br />
387.6<br />
O<strong>the</strong>r operating income and expense<br />
0.4<br />
(8.9)<br />
(38.5)<br />
Operating Profit<br />
367.6<br />
402.2<br />
348.9<br />
Finance costs<br />
(29.3)<br />
(19.1)<br />
(12.0)<br />
78<br />
overviews<br />
O<strong>the</strong>r financial income and expense<br />
Share of profits/(losses) of associates<br />
Profit Before Tax<br />
Income tax expense<br />
(33.4)<br />
-<br />
304.9<br />
(94.2)<br />
(7.8)<br />
-<br />
375.5<br />
(113.1)<br />
(4.2)<br />
-<br />
332.7<br />
(89.4)<br />
Profit For The Period<br />
210.7<br />
262.4<br />
243.3<br />
Minority interests<br />
(16.5)<br />
(26.4)<br />
(23.2)<br />
Profit Attributable To Equity Holders<br />
194.2<br />
236.1<br />
220.1<br />
Earnings Per Share (in €)<br />
Basic earnings per share<br />
4.07<br />
4.93<br />
4.64<br />
Diluted earnings per share<br />
4.01<br />
4.81<br />
4.54<br />
Consolidated Balance Sheet<br />
In € millions<br />
31/12/2012<br />
31/12/2011*<br />
31/12/2010*<br />
ASSETS<br />
Non-current assets<br />
1,490.8<br />
1,508.8<br />
1,302.1<br />
Inventories<br />
681.0<br />
702.2<br />
635.5<br />
Trade receivables<br />
835.8<br />
828.4<br />
733.9<br />
O<strong>the</strong>r receivables<br />
83.8<br />
71.6<br />
59.4<br />
Current tax assets<br />
41.0<br />
57.6<br />
26.8<br />
Short-term derivative instruments<br />
14.9<br />
7.8<br />
14.1<br />
Cash and cash equivalents<br />
398.7<br />
196.0<br />
236.6<br />
Current assets<br />
2,055.1<br />
1,863.5<br />
1,706.3<br />
TOTAL ASSETS<br />
3,545.9<br />
3,372.3<br />
3,008.4<br />
EQUITY & LIABILITIES<br />
Equity attributable to equity holders<br />
1,331.8<br />
1,218.3<br />
1,373.4<br />
Minority interests<br />
130.3<br />
123.4<br />
173.1<br />
Equity<br />
1,462.1<br />
1,341.7<br />
1,546.5<br />
Long-term borrowings<br />
653.6<br />
534.1<br />
201.8<br />
O<strong>the</strong>r non-current liabilities<br />
292.5<br />
265.2<br />
236.1<br />
Non-current liabilities<br />
946.1<br />
799.3<br />
437.9<br />
Trade payables<br />
508.0<br />
515.6<br />
494.4<br />
O<strong>the</strong>r current liabilities<br />
298.6<br />
332.1<br />
170.1<br />
Short-term borrowings<br />
331.1<br />
383.6<br />
359.5<br />
Current liabilities<br />
1,137.7<br />
1,231.3<br />
1,024.0<br />
TOTAL EQUITY AND LIABILITIES<br />
3,545.9<br />
3,372.3<br />
3,008.4<br />
*Restated for <strong>the</strong> retrospective application of IAS 19R.