Structural Health Monitoring Using Smart Sensors - ideals ...
Structural Health Monitoring Using Smart Sensors - ideals ...
Structural Health Monitoring Using Smart Sensors - ideals ...

Create successful ePaper yourself
Turn your PDF publications into a flip-book with our unique Google optimized e-Paper software.
200<br />
3<br />
Phase of spectral densities (degree)<br />
100<br />
0<br />
-100<br />
Phase of spectral densities (degree)<br />
2<br />
1<br />
0<br />
-1<br />
-2<br />
-200<br />
0 20 40 60 80 100<br />
Frequency (Hz)<br />
(a) zoom-out<br />
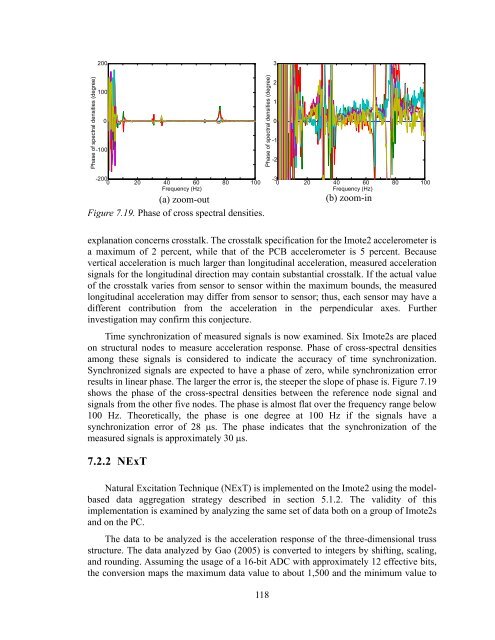
Figure 7.19. Phase of cross spectral densities.<br />
-3<br />
0 20 40 60 80 100<br />
Frequency (Hz)<br />
(b) zoom-in<br />
explanation concerns crosstalk. The crosstalk specification for the Imote2 accelerometer is<br />
a maximum of 2 percent, while that of the PCB accelerometer is 5 percent. Because<br />
vertical acceleration is much larger than longitudinal acceleration, measured acceleration<br />
signals for the longitudinal direction may contain substantial crosstalk. If the actual value<br />
of the crosstalk varies from sensor to sensor within the maximum bounds, the measured<br />
longitudinal acceleration may differ from sensor to sensor; thus, each sensor may have a<br />
different contribution from the acceleration in the perpendicular axes. Further<br />
investigation may confirm this conjecture.<br />
Time synchronization of measured signals is now examined. Six Imote2s are placed<br />
on structural nodes to measure acceleration response. Phase of cross-spectral densities<br />
among these signals is considered to indicate the accuracy of time synchronization.<br />
Synchronized signals are expected to have a phase of zero, while synchronization error<br />
results in linear phase. The larger the error is, the steeper the slope of phase is. Figure 7.19<br />
shows the phase of the cross-spectral densities between the reference node signal and<br />
signals from the other five nodes. The phase is almost flat over the frequency range below<br />
100 Hz. Theoretically, the phase is one degree at 100 Hz if the signals have a<br />
synchronization error of 28 s. The phase indicates that the synchronization of the<br />
measured signals is approximately 30 s.<br />
7.2.2 NExT<br />
Natural Excitation Technique (NExT) is implemented on the Imote2 using the modelbased<br />
data aggregation strategy described in section 5.1.2. The validity of this<br />
implementation is examined by analyzing the same set of data both on a group of Imote2s<br />
and on the PC.<br />
The data to be analyzed is the acceleration response of the three-dimensional truss<br />
structure. The data analyzed by Gao (2005) is converted to integers by shifting, scaling,<br />
and rounding. Assuming the usage of a 16-bit ADC with approximately 12 effective bits,<br />
the conversion maps the maximum data value to about 1,500 and the minimum value to<br />
118