Structural Health Monitoring Using Smart Sensors - ideals ...
Structural Health Monitoring Using Smart Sensors - ideals ...
Structural Health Monitoring Using Smart Sensors - ideals ...

You also want an ePaper? Increase the reach of your titles
YUMPU automatically turns print PDFs into web optimized ePapers that Google loves.
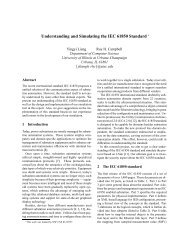
8 x10⁻³ Time (sec)<br />
Correlation function (g 2 )<br />
4<br />
0<br />
-4<br />
0 0.4 0.8 1.2 1.6<br />
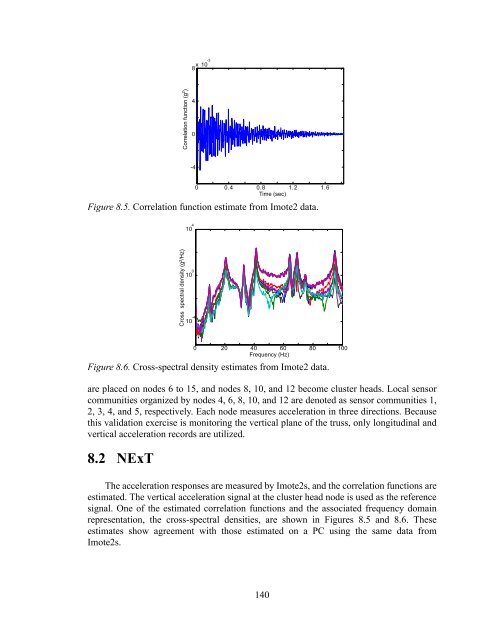
Figure 8.5. Correlation function estimate from Imote2 data.<br />
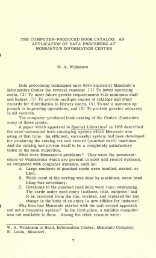
10 4 Frequency (Hz)<br />
Cross spectral density (g 2 /Hz)<br />
10 0<br />
10 -4<br />
are placed on nodes 6 to 15, and nodes 8, 10, and 12 become cluster heads. Local sensor<br />
communities organized by nodes 4, 6, 8, 10, and 12 are denoted as sensor communities 1,<br />
2, 3, 4, and 5, respectively. Each node measures acceleration in three directions. Because<br />
this validation exercise is monitoring the vertical plane of the truss, only longitudinal and<br />
vertical acceleration records are utilized.<br />
8.2 NExT<br />
0 20 40 60 80 100<br />
Figure 8.6. Cross-spectral density estimates from Imote2 data.<br />
The acceleration responses are measured by Imote2s, and the correlation functions are<br />
estimated. The vertical acceleration signal at the cluster head node is used as the reference<br />
signal. One of the estimated correlation functions and the associated frequency domain<br />
representation, the cross-spectral densities, are shown in Figures 8.5 and 8.6. These<br />
estimates show agreement with those estimated on a PC using the same data from<br />
Imote2s.<br />
140