Structural Health Monitoring Using Smart Sensors - ideals ...
Structural Health Monitoring Using Smart Sensors - ideals ...
Structural Health Monitoring Using Smart Sensors - ideals ...

Create successful ePaper yourself
Turn your PDF publications into a flip-book with our unique Google optimized e-Paper software.
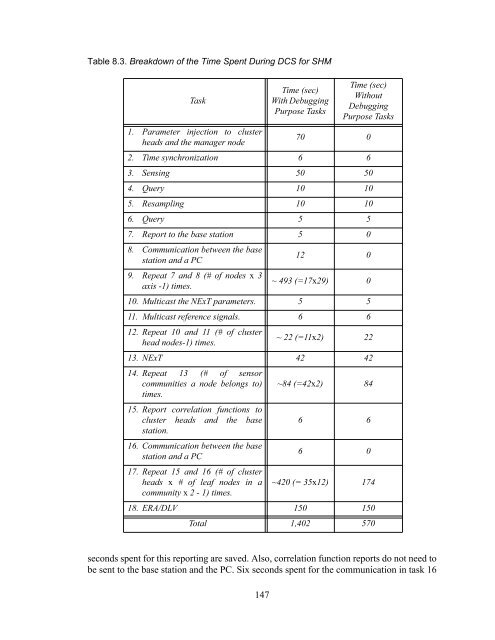
Table 8.3. Breakdown of the Time Spent During DCS for SHM<br />
Task<br />
1. Parameter injection to cluster<br />
heads and the manager node<br />
Time (sec)<br />
With Debugging<br />
Purpose Tasks<br />
Time (sec)<br />
Without<br />
Debugging<br />
Purpose Tasks<br />
70 0<br />
2. Time synchronization 6 6<br />
3. Sensing 50 50<br />
4. Query 10 10<br />
5. Resampling 10 10<br />
6. Query 5 5<br />
7. Report to the base station 5 0<br />
8. Communication between the base<br />
station and a PC<br />
12 0<br />
9. Repeat 7 and 8 (# of nodes x 3<br />
axis -1) times.<br />
~ 493 (=17x29) 0<br />
10. Multicast the NExT parameters. 5 5<br />
11. Multicast reference signals. 6 6<br />
12. Repeat 10 and 11 (# of cluster<br />
head nodes-1) times.<br />
~ 22 (=11x2) 22<br />
13. NExT 42 42<br />
14. Repeat 13 (# of sensor<br />
communities a node belongs to)<br />
times.<br />
~84 (=42x2) 84<br />
15. Report correlation functions to<br />
cluster heads and the base<br />
station.<br />
16. Communication between the base<br />
station and a PC<br />
17. Repeat 15 and 16 (# of cluster<br />
heads x # of leaf nodes in a<br />
community x 2 - 1) times.<br />
6 6<br />
6 0<br />
~420 (= 35x12) 174<br />
18. ERA/DLV 150 150<br />
Total 1,402 570<br />
seconds spent for this reporting are saved. Also, correlation function reports do not need to<br />
be sent to the base station and the PC. Six seconds spent for the communication in task 16<br />
147