Structural Health Monitoring Using Smart Sensors - ideals ...
Structural Health Monitoring Using Smart Sensors - ideals ...
Structural Health Monitoring Using Smart Sensors - ideals ...

You also want an ePaper? Increase the reach of your titles
YUMPU automatically turns print PDFs into web optimized ePapers that Google loves.
(a)<br />
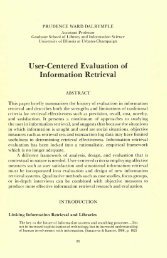
Figure 5.6. Effect of data loss and observation noise: coherence functions between (a)<br />
nodes 11 and 19; and (b) nodes 19 and 25.<br />
in Figure 5.6. The isolated downswings correspond to zeroes of the system; extremely<br />
small responses of the structure at these frequencies at the zeros result in numerical error,<br />
giving small coherence function.<br />
The loss of 0.5 percent of data yields a much smaller coherence function, except at the<br />
system’s poles (see Figure 5.6). Because of the random nature of data loss occurrence and<br />
the excitation, the coherence function varies from simulation to simulation. Twenty time<br />
average of the coherence functions are shown in this figure. The coherence function’s<br />
discrepancy from unity depends on the two measurement nodes between which the<br />
function is calculated. All of the investigated coherence function plots, however, support<br />
that the loss of 0.5 percent of data affects the coherence function in a similar way as 5 to<br />
10 percent measurement noise addition.<br />
Though the data loss clearly impacts the PSD estimation and coherence function<br />
negatively, the consequence in subsequent modal analyses is unclear. The modal<br />
properties are mainly represented by frequency components near the natural frequency.<br />
The PSD and coherence function are not affected by data loss and noise as much near the<br />
poles. The ERA modal analysis method is then applied to the impulse response functions<br />
to estimate the modal properties. Impulse response functions are the inverse Fourier<br />
transform of the transfer functions from the input force to measured outputs, which is<br />
calculated from CSD and PSDs.<br />
Figure 5.7 shows how the estimates of the first natural frequency and the damping<br />
ratio vary as a function of the data loss level. For comparison, these modal parameters are<br />
also estimated from the simulation model subjected to measurement noise (see Figure<br />
5.8). Again, a loss of 0.5 percent of data is approximately equivalent to 5 to 10 percent<br />
measurement noise.<br />
The first four modes are identified and these modal properties are used to estimate the<br />
flexibility matrix F <br />
. The flexibility matrix estimate Fˆ<br />
is compared with F <br />
and the<br />
estimation error is shown in Figure 5.9 in terms of the Frobenius norm. represents the<br />
59<br />
(b)<br />
F