Structural Health Monitoring Using Smart Sensors - ideals ...
Structural Health Monitoring Using Smart Sensors - ideals ...
Structural Health Monitoring Using Smart Sensors - ideals ...

You also want an ePaper? Increase the reach of your titles
YUMPU automatically turns print PDFs into web optimized ePapers that Google loves.
4<br />
set value: 560 Hz<br />
3<br />
Count<br />
2<br />
1<br />
0<br />
520 530 540 550 560 570 580 590 600 610 620<br />
Sampling frequency (Hz)<br />
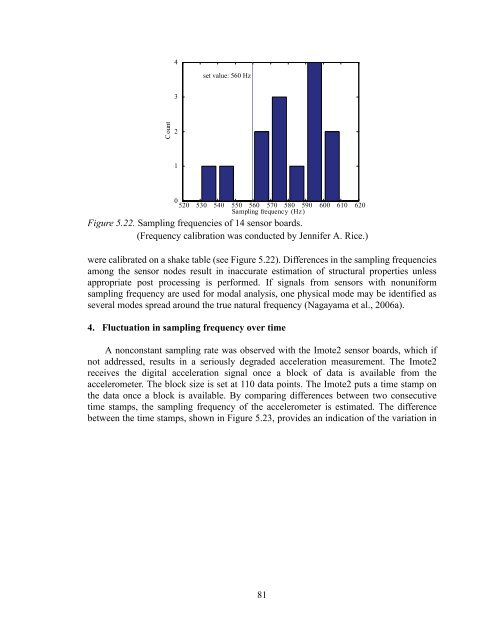
Figure 5.22. Sampling frequencies of 14 sensor boards.<br />
(Frequency calibration was conducted by Jennifer A. Rice.)<br />
were calibrated on a shake table (see Figure 5.22). Differences in the sampling frequencies<br />
among the sensor nodes result in inaccurate estimation of structural properties unless<br />
appropriate post processing is performed. If signals from sensors with nonuniform<br />
sampling frequency are used for modal analysis, one physical mode may be identified as<br />
several modes spread around the true natural frequency (Nagayama et al., 2006a).<br />
4. Fluctuation in sampling frequency over time<br />
A nonconstant sampling rate was observed with the Imote2 sensor boards, which if<br />
not addressed, results in a seriously degraded acceleration measurement. The Imote2<br />
receives the digital acceleration signal once a block of data is available from the<br />
accelerometer. The block size is set at 110 data points. The Imote2 puts a time stamp on<br />
the data once a block is available. By comparing differences between two consecutive<br />
time stamps, the sampling frequency of the accelerometer is estimated. The difference<br />
between the time stamps, shown in Figure 5.23, provides an indication of the variation in<br />
81