Structural Health Monitoring Using Smart Sensors - ideals ...
Structural Health Monitoring Using Smart Sensors - ideals ...
Structural Health Monitoring Using Smart Sensors - ideals ...

Create successful ePaper yourself
Turn your PDF publications into a flip-book with our unique Google optimized e-Paper software.
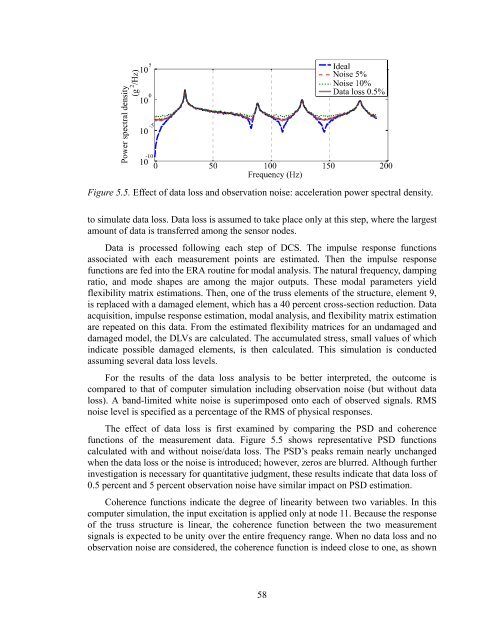
Figure 5.5. Effect of data loss and observation noise: acceleration power spectral density.<br />
to simulate data loss. Data loss is assumed to take place only at this step, where the largest<br />
amount of data is transferred among the sensor nodes.<br />
Data is processed following each step of DCS. The impulse response functions<br />
associated with each measurement points are estimated. Then the impulse response<br />
functions are fed into the ERA routine for modal analysis. The natural frequency, damping<br />
ratio, and mode shapes are among the major outputs. These modal parameters yield<br />
flexibility matrix estimations. Then, one of the truss elements of the structure, element 9,<br />
is replaced with a damaged element, which has a 40 percent cross-section reduction. Data<br />
acquisition, impulse response estimation, modal analysis, and flexibility matrix estimation<br />
are repeated on this data. From the estimated flexibility matrices for an undamaged and<br />
damaged model, the DLVs are calculated. The accumulated stress, small values of which<br />
indicate possible damaged elements, is then calculated. This simulation is conducted<br />
assuming several data loss levels.<br />
For the results of the data loss analysis to be better interpreted, the outcome is<br />
compared to that of computer simulation including observation noise (but without data<br />
loss). A band-limited white noise is superimposed onto each of observed signals. RMS<br />
noise level is specified as a percentage of the RMS of physical responses.<br />
The effect of data loss is first examined by comparing the PSD and coherence<br />
functions of the measurement data. Figure 5.5 shows representative PSD functions<br />
calculated with and without noise/data loss. The PSD’s peaks remain nearly unchanged<br />
when the data loss or the noise is introduced; however, zeros are blurred. Although further<br />
investigation is necessary for quantitative judgment, these results indicate that data loss of<br />
0.5 percent and 5 percent observation noise have similar impact on PSD estimation.<br />
Coherence functions indicate the degree of linearity between two variables. In this<br />
computer simulation, the input excitation is applied only at node 11. Because the response<br />
of the truss structure is linear, the coherence function between the two measurement<br />
signals is expected to be unity over the entire frequency range. When no data loss and no<br />
observation noise are considered, the coherence function is indeed close to one, as shown<br />
58