Structural Health Monitoring Using Smart Sensors - ideals ...
Structural Health Monitoring Using Smart Sensors - ideals ...
Structural Health Monitoring Using Smart Sensors - ideals ...

You also want an ePaper? Increase the reach of your titles
YUMPU automatically turns print PDFs into web optimized ePapers that Google loves.
Initialization: within local sensor communities<br />
Inject parameters<br />
• NodeID<br />
• Measurement direction<br />
•# of samples<br />
• NExT/ERA parameters<br />
• Modal parameters from the previous<br />
step<br />
Time synchronization<br />
• Send beacon signal<br />
• Estimate local clock offset<br />
• Estimate clock drift<br />
Sensing<br />
• Update local clock offset<br />
• Start sensing<br />
• Copy acquired data to global<br />
variables<br />
• Acquire timestamp of each block of<br />
data<br />
• resample and synchronize the<br />
measured data<br />
Report to the base station<br />
Correlation function estimation<br />
• broadcast data<br />
• cross-spectral density estimation<br />
•ifft<br />
•averaging<br />
yes<br />
Need more<br />
averaging ?<br />
no<br />
Report to the cluster heads and base<br />
station<br />
ERA<br />
Report to the base station<br />
Inject parameters<br />
•NodeID<br />
• Measurement direction<br />
•# of samples<br />
• NExT/ERA parameters<br />
• Modal parameters from the previous<br />
step<br />
• mass normalization constants<br />
Time synchronization<br />
• Send beacon signal<br />
• Estimate local clock offset<br />
• Estimate clock drift<br />
Sensing<br />
• Update local clock offset<br />
• Start sensing<br />
• Copy acquired data to global<br />
variables<br />
• Acquire timestamp of each block of<br />
data<br />
• resample and synchronize the<br />
measured data<br />
Report to the base station<br />
Correlation function estimation<br />
• broadcast data<br />
• cross-spectral density estimation<br />
• ifft<br />
•averaging<br />
yes<br />
Need more<br />
averaging ?<br />
Report to the cluster heads and base<br />
station<br />
ERA/DLV<br />
<strong>Monitoring</strong><br />
no<br />
Report to the base station<br />
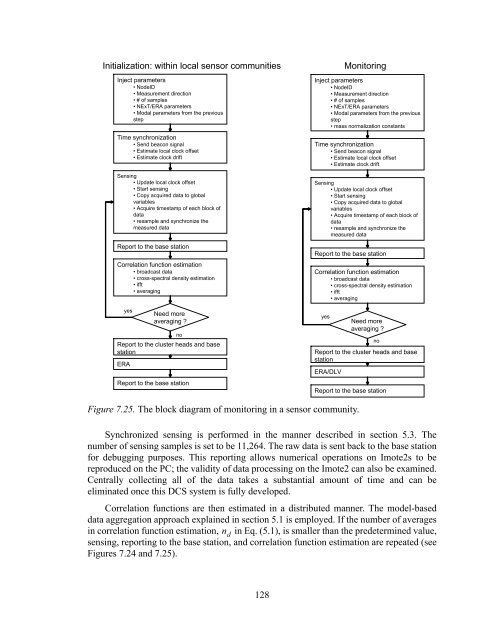
Figure 7.25. The block diagram of monitoring in a sensor community.<br />
Synchronized sensing is performed in the manner described in section 5.3. The<br />
number of sensing samples is set to be 11,264. The raw data is sent back to the base station<br />
for debugging purposes. This reporting allows numerical operations on Imote2s to be<br />
reproduced on the PC; the validity of data processing on the Imote2 can also be examined.<br />
Centrally collecting all of the data takes a substantial amount of time and can be<br />
eliminated once this DCS system is fully developed.<br />
Correlation functions are then estimated in a distributed manner. The model-based<br />
data aggregation approach explained in section 5.1 is employed. If the number of averages<br />
in correlation function estimation, n d<br />
in Eq. (5.1), is smaller than the predetermined value,<br />
sensing, reporting to the base station, and correlation function estimation are repeated (see<br />
Figures 7.24 and 7.25).<br />
128