Structural Health Monitoring Using Smart Sensors - ideals ...
Structural Health Monitoring Using Smart Sensors - ideals ...
Structural Health Monitoring Using Smart Sensors - ideals ...

You also want an ePaper? Increase the reach of your titles
YUMPU automatically turns print PDFs into web optimized ePapers that Google loves.
percent noise. The flexibility matrix is estimated both before and after damage is<br />
introduced, and then the DLV method is applied to these matrices. The accumulated stress<br />
calculated in the DLV method is an indication of damage. The stress in a damaged<br />
member should be zero. The accumulated stress in the damaged element is plotted on<br />
Figure 5.9, together with the flexibility matrix estimation error. The stress is indeed zero<br />
for 0 percent data loss. As the amount of data loss increases, the accumulated stress<br />
becomes larger. A stress value around 0.1 is considered small, indicating that the element<br />
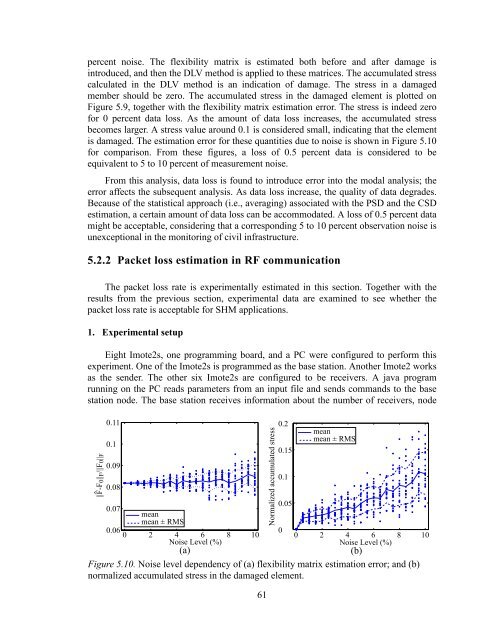
is damaged. The estimation error for these quantities due to noise is shown in Figure 5.10<br />
for comparison. From these figures, a loss of 0.5 percent data is considered to be<br />
equivalent to 5 to 10 percent of measurement noise.<br />
From this analysis, data loss is found to introduce error into the modal analysis; the<br />
error affects the subsequent analysis. As data loss increase, the quality of data degrades.<br />
Because of the statistical approach (i.e., averaging) associated with the PSD and the CSD<br />
estimation, a certain amount of data loss can be accommodated. A loss of 0.5 percent data<br />
might be acceptable, considering that a corresponding 5 to 10 percent observation noise is<br />
unexceptional in the monitoring of civil infrastructure.<br />
5.2.2 Packet loss estimation in RF communication<br />
The packet loss rate is experimentally estimated in this section. Together with the<br />
results from the previous section, experimental data are examined to see whether the<br />
packet loss rate is acceptable for SHM applications.<br />
1. Experimental setup<br />
Eight Imote2s, one programming board, and a PC were configured to perform this<br />
experiment. One of the Imote2s is programmed as the base station. Another Imote2 works<br />
as the sender. The other six Imote2s are configured to be receivers. A java program<br />
running on the PC reads parameters from an input file and sends commands to the base<br />
station node. The base station receives information about the number of receivers, node<br />
||F-F0||F/||F0||F<br />
<br />
0.11<br />
0.1<br />
0.09<br />
0.08<br />
0.07<br />
mean<br />
mean ± RMS<br />
0.06<br />
0 2 4 6<br />
Noise Level (%)<br />
8 10<br />
(a)<br />
61<br />
Normalized accumulated stress<br />
0.2<br />
0.15<br />
0.1<br />
0.05<br />
0<br />
mean<br />
mean ± RMS<br />
0 2 4 6 8 10<br />
Noise Level (%)<br />
Figure 5.10. Noise level dependency of (a) flexibility matrix estimation error; and (b)<br />
normalized accumulated stress in the damaged element.<br />
(b)