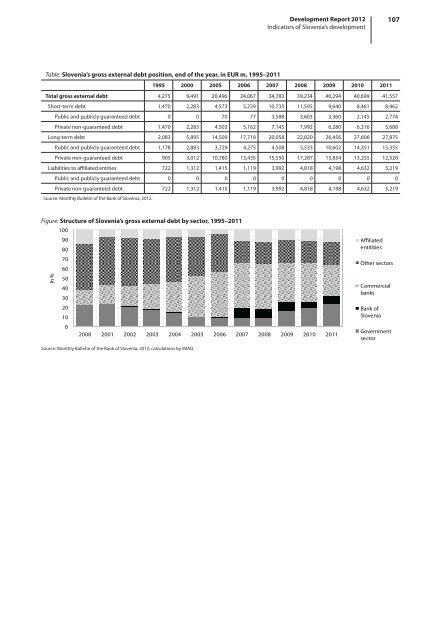
106 Development Report <strong>2012</strong> Indicators of Slovenia’s <strong>development</strong> Gross external debt Amid a more moderate growth of gross external debt, the debt of the general government has increased rapidly since the beginning of the financial and economic crisis. After expanding by EUR 0.4 bn in 2010, gross external debt climbed to EUR 41.6 bn by the end of 2011 and was EUR 0.9 bn higher than in December 2010. Also in 2011 most of the increase was contributed by the gross external debt of the general government, which rose by roughly the same amount as a year earlier, by EUR 1.7 bn to EUR 9.8 bn. Gross external debt increased mainly in the first quarter, when the government issued 10- and 15- year bonds in the total amount of EUR 3.0 bn. 1 At the end of the year, general government debt accounted for 23.7% of the total gross external debt, which is somewhat more than at the end of 2010 (20.1%). The debt of affiliated companies (enterprises with a 10% or higher foreign ownership share) also rose to a similar extent as in the previous year, by EUR 0.6 bn to EUR 5.2 bn; approximately two thirds of debt was generated by non-banking financial institutions involved in financial leasing, the rest by non-financial corporations (companies). After the slight decline in the previous year, the debt of other sectors (companies, in particular) also grew last year, by EUR 0.4 bn to EUR 9.9 bn. Its growth was largely a consequence of borrowing in the form of short-term and long-term loans, which companies had been repaying in the previous year. The volume of short-term commercial credits used by Slovenian companies to finance the imports of goods and services expanded again, yet less than in 2010. Commercial banks were repaying external debt for the third year in a row. Their external debt, which amounted to EUR 13.6 bn, was EUR 2.5 bn lower than at the end of 2010 (in 2010 it had dropped by EUR 0.4 bn). Banks net repaid EUR 2.3 bn in 2011 (EUR 1.5 bn in foreign loans and EUR 0.8 bn in deposits), EUR 0.8 bn more than a year earlier. They also carried out an early redemption of part of state-guaranteed bonds. The share of bank debt in gross external debt thus shrank considerably in 2011, from 39.3% in 2010 to 32.7%. Owing to the limited access to foreign sources of finance, banks had to tap central bank funds last year. Having declined in the previous two years, the debt of the Bank of Slovenia thus increased by EUR 0.6 bn last year, to EUR 3.0 bn, as the Bank of Slovenia borrowed short-term from the Eurosystem again to provide liquidity for domestic commercial banks. The long-term debt of the BS in the form of other debt liabilities remained at the same level as in 2010. 1 At 4.375% and 5.125% interest rates, respectively. Looking at the structure of gross external debt, in 2011 public debt increased again, while publicly guaranteed debt remained around the previous year’s level and non-guaranteed private debt declined. Private non-guaranteed debt was dropping in the past three years, most notably in 2009 and 2010. In 2011, repayments of liabilities amounted to EUR 0.8 bn, so that private debt declined to EUR 23.4 bn. Public and publicly guaranteed debt combined rose further in 2011, but at more moderate growth rates than in the preceding two years. Specifically, public debt 2 grew by roughly the same amount as in 2010 (EUR 1.7 bn), while publicly guaranteed debt 3 remained around the 2010 level (EUR 18.1 bn in total, of which public debt EUR 9.8 bn). The volume of guarantees to domestic financial institutions declined, while the BS’s liabilities to the Eurosystem increased. At the end of 2011, public and publicly guaranteed debts accounted for 43.7% of gross external debt (of which public debt for 23.7% and publicly guaranteed debt for 20.9%), which is 20.4 p.p. more than in 2008. Excluding liabilities to affiliated entities, which are not tracked for maturity, long-term debt represented 76.7% of total gross external debt, which is 0.2 p.p. more than in 2010. Slovenia remains among the least indebted countries in the euro area. At the end of 2011, its gross external debt climbed to 116.6 % of GDP (a 1.7 p.p. higher figure than a year earlier). This is still much less than the average debt in the euro area, which had already reached 209.2% of GDP in 2010. As the euro is the predominant currency in the currency structure of external debt and with trade and capital flows in euros representing the prevailing share in the structure of flows, the fluctuations of the exchange rate do not pose a significant risk of an increase in the share of gross external debt in GDP or for its repayment. The risks are related to possible major shocks that could reduce economic growth and to a pronounced tightening in borrowing conditions. 2 External public debt is generated with borrowing of the institutional government sector (according to ESA 95) on foreign financial markets. The government may borrow from international financial institutions, foreign governments or government agencies, foreign commercial banks, and even from private lenders in the event of an issue of transferrable securities on a foreign financial market. 3 Publicly guaranteed debt is a liability of a private legal entity, but payment is guaranteed by the state. Publicly guaranteed debt includes Bank of Slovenia liabilities to the Eurosystem incurred by the transfer of monetary policy from the BS to the ECB.
Development Report <strong>2012</strong> Indicators of Slovenia’s <strong>development</strong> 107 Table: Slovenia’s gross external debt position, end of the year, in EUR m, 1995–2011 1995 2000 2005 2006 2007 2008 2009 2010 2011 Total gross external debt 4,275 9,491 20,496 24,067 34,783 39,234 40,294 40,699 41,557 Short-term debt 1,470 2,283 4,573 5,239 10,733 11,595 9,640 8,461 8,462 Public and publicly guaranteed debt 0 0 70 77 3,588 3,603 3,360 2,145 2,774 Private non-guaranteed debt 1,470 2,283 4,503 5,162 7,145 7,992 6,280 6,316 5,688 Long-term debt 2,083 5,895 14,509 17,710 20,058 22,820 26,456 27,606 27,875 Public and publicly guaranteed debt 1,178 2,883 3,729 4,275 4,508 5,533 10,602 14,351 15,355 Private non-guaranteed debt 905 3,012 10,780 13,435 15,550 17,287 15,854 13,255 12,520 Liabilities to affiliated entities 722 1,312 1,415 1,119 3,992 4,818 4,198 4,632 5,219 Public and publicly guaranteed debt 0 0 0 0 0 0 0 0 0 Private non-guaranteed debt 722 1,312 1,415 1,119 3,992 4,818 4,198 4,632 5,219 Source: Monthly Bulletin of the Bank of Slovenia, <strong>2012</strong>. Figure: Structure of Slovenia’s gross external debt by sector, 1995–2011 100 90 80 70 60 In % 50 40 30 20 10 0 2000 2001 2002 2003 2004 2005 2006 2007 2008 2009 2010 2011 Source: Monthly Bulletin of the Bank of Slovenia, <strong>2012</strong>; calculations by IMAD. Affiliated entitities Other sectors Commercial banks Bank of Slovenia Government sector