

development report 2012 - UMAR
development report 2012 - UMAR
development report 2012 - UMAR

You also want an ePaper? Increase the reach of your titles
YUMPU automatically turns print PDFs into web optimized ePapers that Google loves.
Development Report <strong>2012</strong><br />
Indicators of Slovenia’s <strong>development</strong><br />
167<br />
Table: State aids (excluding aid to remedy the effects of the economic crisis and aid for rail transport), as a % of GDP<br />
1995 2000 2005 2006 2007 2008 2009 2010<br />
EU-27 1.0 0.6 0.6 0.8 0.5 0.6 0.6 0.6<br />
Austria 1.1 0.7 0.5 0.8 0.4 0.7 0.9 0.8<br />
Belgium 0.6 0.5 0.4 0.4 0.4 0.4 0.6 0.6<br />
Bulgaria N/A N/A 0.1 0.1 0.6 0.6 0.5 0.1<br />
Cyprus N/A 2.6 1.4 0.6 0.7 0.6 1.0 0.7<br />
Czech Republic N/A 2.4 0.6 0.8 0.8 1.0 0.7 0.8<br />
Denmark 0.7 1.0 0.8 0.8 0.8 0.8 1.0 0.9<br />
Estonia N/A 0.1 0.3 0.3 0.2 0.3 0.3 0.3<br />
Finland 2.8 1.4 1.3 1.3 1.1 1.1 1.2 1.1<br />
France 0.8 0.6 0.6 1.7 0.5 0.7 0.8 0.8<br />
Greece 1.4 0.6 0.4 0.4 0.5 0.7 0.9 0.8<br />
Ireland 0.7 1.1 0.5 0.5 0.7 1.2 0.9 1.0<br />
Italy 1.2 0.5 0.4 0.4 0.4 0.4 0.4 0.3<br />
Latvia N/A 0.7 1.1 1.3 2.2 0.6 0.7 0.9<br />
Lithuania N/A 0.3 0.5 0.5 0.6 0.4 0.6 0.6<br />
Luxembourg 0.5 0.3 0.3 0.2 0.2 0.2 0.3 0.2<br />
Hungary N/A 1.1 3.2 2.3 1.9 2.4 1.8 2.3<br />
Malta N/A 3.4 3.5 2.8 2.4 1.9 1.9 1.4<br />
Germany 1.4 0.8 0.7 0.8 0.6 0.6 0.7 0.6<br />
Netherlands 0.4 0.5 0.4 0.4 0.4 0.4 0.5 0.5<br />
Poland N/A 1.0 0.8 0.9 0.6 0.9 0.9 0.9<br />
Portugal 0.9 0.8 0.9 0.9 1.3 0.9 1.0 0.9<br />
Romania N/A N/A 0.6 0.7 1.2 0.6 0.7 0.2<br />
Slovakia N/A 0.4 0.6 0.5 0.4 0.6 0.5 0.5<br />
Slovenia N/A 1.0 0.7 0.7 0.6 0.7 1.0 1.1<br />
Spain 1.0 0.9 0.5 0.5 0.5 0.5 0.5 0.5<br />
Sweden 0.5 0.4 1.0 1.0 0.9 0.9 0.9 0.8<br />
United Kingdom 0.4 0.2 0.2 0.2 0.3 0.2 0.3 0.3<br />
Source: State Aid Scoreboard, Autumn 2011, (European Commission), 2011.<br />
Note: N/A – not available.<br />
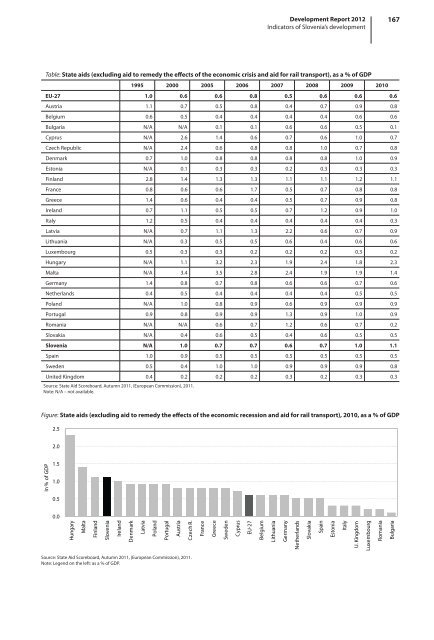
Figure: State aids (excluding aid to remedy the effects of the economic recession and aid for rail transport), 2010, as a % of GDP<br />
2.5<br />
2.0<br />
In % of GDP<br />
1.5<br />
1.0<br />
0.5<br />
0.0<br />
Hungary<br />
Malta<br />
Finland<br />
Slovenia<br />
Ireland<br />
Denmark<br />
Latvia<br />
Poland<br />
Portugal<br />
Austria<br />
Czech R.<br />
France<br />
Greece<br />
Sweden<br />
Cyprus<br />
EU-27<br />
Belgium<br />
Lithuania<br />
Germany<br />
Netherlands<br />
Slovakia<br />
Spain<br />
Estonia<br />
Italy<br />
U. Kingdom<br />
Luxembourg<br />
Romania<br />
Bulgaria<br />
Source: State Aid Scoreboard, Autumn 2011, (European Commission), 2011.<br />
Note: Legend on the left: as a % of GDP.


