

development report 2012 - UMAR
development report 2012 - UMAR
development report 2012 - UMAR

Create successful ePaper yourself
Turn your PDF publications into a flip-book with our unique Google optimized e-Paper software.
38 Development Report <strong>2012</strong><br />
Development by the priorities of SDS – Efficient use of knowledge for economic <strong>development</strong> and high-quality jobs<br />
implementation 75 , almost stopped in the past year. A<br />
continued increasing trend has been observed in the<br />
share of enrolment in four- and five-year secondary<br />
technical and other professional programmes, while the<br />
share of enrolment in general upper secondary schools<br />
has recorded a decrease for the second year in a row.<br />
Young people’s lack of interest in vocational education<br />
is not surprising; according to a Eurobarometer Special<br />
Survey 76 Slovenia was ranked among those countries<br />
in which vocational education had the least favourable<br />
image 77 . In comparison to those in other EU Member<br />
States, the respondents in Slovenia assess the situation<br />
in the area of vocational education as poor and also<br />
perceive its status as low 78 .<br />
As regards the tertiary education enrolment structure,<br />
a decrease in the social sciences enrolment rate has<br />
been noted. A continued downward trend in the social<br />
studies enrolment rate was observed in the academic<br />
year 2010/2011 compared to overall enrolment in tertiary<br />
education. It dropped from 43.5% in 2005 to 34.7% in<br />
2010. The resulting decrease in the share of social study<br />
graduates was recorded in 2010 and amounted to 44.3%<br />
(1.2 p.p. less than in 2005). During SDS’s implementation,<br />
the share of science and technology graduates 79 has<br />
increased, but Slovenia still lags behind the EU average<br />
in terms of their number per 1,000 inhabitants aged from<br />
20 to 29 years 80 .<br />
Some tertiary education quality criteria show that<br />
only a modest improvement has been achieved during<br />
SDS’s implementation. The ratio between the number of<br />
students in tertiary education and the number of teaching<br />
75<br />
The share of young people participating in lower and upper<br />
vocational schools amounted to 15% in the 2010/2011 academic<br />
year and decreased by 4.1 p.p. during SDS's implementation.<br />
76<br />
Attitudes towards vocational education and training, Special<br />
Eurobarometer 369, 2011.<br />
77<br />
In Malta and Finland, vocational education is well regarded<br />
by approximately 90% of respondents; the EU average stands at<br />
71%, while in Slovenia only 50% of respondents say that it has<br />
a positive image.<br />
78<br />
The share of respondents who believe that individuals<br />
participating in vocational education and training acquire<br />
the skills required by employers, are given access to modern<br />
equipment (computers, machines, etc.), and have confidence in<br />
teacher competence, is among the lowest in EU Member States.<br />
The share of respondents who believe that vocational education<br />
does not prepare people to set up their own business and does<br />
not provide communication and teamwork skills is among the<br />
highest in EU Member States. The share of respondents who<br />
believe that vocational education and training lead to well-paid<br />
jobs is among the lowest in the EU, while the share of those<br />
believing that vocational education and training lead to jobs<br />
which are not well regarded in society is among the highest in<br />
the EU.<br />
79<br />
In 2010, the share of science and technology graduates was<br />
21.1%, which was 2.7 p.p. over 2005 when SDS started to be<br />
implemented; it recorded a particularly strong increase in the<br />
previous year.<br />
80<br />
See Chapter 2.2. and Science and technology graduates<br />
indicator.<br />
staff, which serves as a rough international criterion of<br />
quality, has improved during SDS’s implementation. In<br />
2009 (the most recent data available) the lag behind the<br />
OECD average was considerable and has not substantially<br />
reduced during SDS’s implementation. It should be<br />
pointed out that this unfavourable ratio is partly due to<br />
fictitious enrolments motivated by the benefits offered<br />
by the status of being a student. Progress made in the<br />
area of student mobility, which is one of the study quality<br />
criteria, has been modest. The share of foreign students in<br />
Slovenia has increased during SDS’s implementation, but<br />
was nevertheless among the lowest in the EU 81 . There are<br />
some issues associated with both the high participation<br />
of young people in tertiary education and the low-level<br />
efficiency of studies. In 2010 the average duration of<br />
regular university undergraduate studies did not change<br />
significantly from the previous year; a slight decrease<br />
has been observed during SDS’s implementation (a drop<br />
from 6.8 years to 6.2 years) 82 . This shorter study duration<br />
is partly attributed to the introduction of Bologna study<br />
programmes; the new programmes are shorter than their<br />
precursors and therefore result in a shorter average study<br />
duration. According to the most recent international data<br />
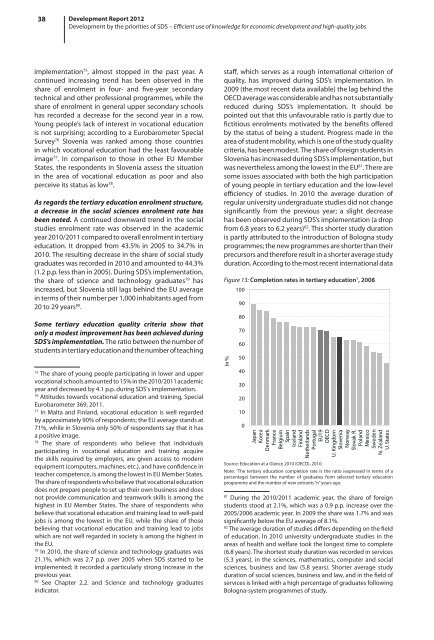
Figure 13: Completion rates in tertiary education 1 , 2008<br />
In %<br />
100<br />
90<br />
80<br />
70<br />
60<br />
50<br />
40<br />
30<br />
20<br />
10<br />
0<br />
Japan<br />
Korea<br />
Denmark<br />
France<br />
Belgium<br />
Spain<br />
Iceland<br />
Finland<br />
Netherlands<br />
Portugal<br />
EU19<br />
OECD<br />
U. Kingdom<br />
Slovenia<br />
Norway<br />
Slovak R.<br />
Poland<br />
Mexico<br />
Sweden<br />
N. Zealand<br />
U. States<br />
Source: Education at a Glance 2010 (OECD), 2010.<br />
Note: 1 The tertiary education completion rate is the ratio (expressed in terms of a<br />
percentage) between the number of graduates from selected tertiary education<br />
programme and the number of new entrants “n” years ago.<br />
81<br />
During the 2010/2011 academic year, the share of foreign<br />
students stood at 2.1%, which was a 0.9 p.p. increase over the<br />
2005/2006 academic year. In 2009 the share was 1.7% and was<br />
significantly below the EU average of 8.1%.<br />
82<br />
The average duration of studies differs depending on the field<br />
of education. In 2010 university undergraduate studies in the<br />
areas of health and welfare took the longest time to complete<br />
(6.8 years). The shortest study duration was recorded in services<br />
(5.3 years), in the sciences, mathematics, computer and social<br />
sciences, business and law (5.8 years). Shorter average study<br />
duration of social sciences, business and law, and in the field of<br />
services is linked with a high percentage of graduates following<br />
Bologna-system programmes of study.


