

development report 2012 - UMAR
development report 2012 - UMAR
development report 2012 - UMAR

Create successful ePaper yourself
Turn your PDF publications into a flip-book with our unique Google optimized e-Paper software.
Development Report <strong>2012</strong><br />
Indicators of Slovenia’s <strong>development</strong><br />
213<br />
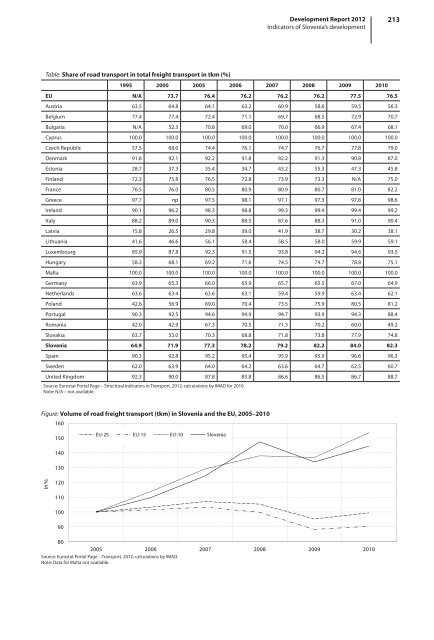
Table: Share of road transport in total freight transport in tkm (%)<br />
1995 2000 2005 2006 2007 2008 2009 2010<br />
EU N/A 73.7 76.4 76.2 76.2 76.2 77.5 76.5<br />
Austria 63.5 64.8 64.1 63.2 60.9 58.6 59.5 56.3<br />
Belgium 77.4 77.4 72.4 71.1 69.7 68.5 72.9 70.7<br />
Bulgaria N/A 52.3 70.8 69.0 70.0 66.9 67.4 68.1<br />
Cyprus 100.0 100.0 100.0 100.0 100.0 100.0 100.0 100.0<br />
Czech Republic 57.5 68.0 74.4 76.1 74.7 76.7 77.8 79.0<br />
Denmark 91.8 92.1 92.2 91.8 92.2 91.3 90.8 87.0<br />
Estonia 28.7 37.3 35.4 34.7 43.2 55.3 47.3 45.8<br />
Finland 72.3 75.8 76.5 72.8 73.9 73.3 N/A 75.0<br />
France 76.5 76.0 80.5 80.9 80.9 80.7 81.0 82.2<br />
Greece 97.7 np 97.5 98.1 97.1 97.3 97.8 98.6<br />
Ireland 90.1 96.2 98.3 98.8 99.3 99.4 99.4 99.2<br />
Italy 88.2 89.0 90.3 88.5 87.6 88.3 91.0 90.4<br />
Latvia 15.8 26.5 29.8 39.0 41.9 38.7 30.2 38.1<br />
Lithuania 41.6 46.6 56.1 58.4 58.5 58.0 59.9 59.1<br />
Luxembourg 85.9 87.8 92.3 91.5 93.8 94.2 94.6 93.5<br />
Hungary 58.3 68.1 69.2 71.6 74.5 74.7 78.8 75.1<br />
Malta 100.0 100.0 100.0 100.0 100.0 100.0 100.0 100.0<br />
Germany 63.9 65.3 66.0 65.9 65.7 65.5 67.0 64.9<br />
Netherlands 63.6 63.4 63.6 63.1 59.4 59.9 63.4 62.1<br />
Poland 42.6 56.9 69.0 70.4 73.5 75.9 80.5 81.2<br />
Portugal 90.3 92.5 94.6 94.9 94.7 93.9 94.3 88.4<br />
Romania 42.0 42.9 67.3 70.5 71.3 70.2 60.0 49.2<br />
Slovakia 63.7 53.0 70.3 68.8 71.8 73.8 77.9 74.8<br />
Slovenia 64.9 71.9 77.3 78.2 79.2 82.2 84.0 82.3<br />
Spain 90.3 92.8 95.2 95.4 95.9 95.9 96.6 96.3<br />
Sweden 62.0 63.9 64.0 64.2 63.6 64.7 62.5 60.7<br />
United Kingdom 92.3 90.0 87.8 85.8 86.6 86.5 86.7 88.7<br />
Source: Eurostat Portal Page – Structural Indicators in Transport, <strong>2012</strong>; calculations by IMAD for 2010.<br />
Note: N/A – not available.<br />
Figure: Volume of road freight transport (tkm) in Slovenia and the EU, 2005–2010<br />
160<br />
150<br />
EU-25 EU-15 EU-10 Slovenia<br />
140<br />
130<br />
In %<br />
120<br />
110<br />
100<br />
90<br />
80<br />
2005 2006 2007 2008 2009 2010<br />
Source: Eurostat Portal Page – Transport, <strong>2012</strong>; calculations by IMAD.<br />
Note: Data for Malta not available.


