

development report 2012 - UMAR
development report 2012 - UMAR
development report 2012 - UMAR

You also want an ePaper? Increase the reach of your titles
YUMPU automatically turns print PDFs into web optimized ePapers that Google loves.
Development Report <strong>2012</strong><br />
Indicators of Slovenia’s <strong>development</strong><br />
215<br />
Table: Implicit tax rate on energy consumption, 1 in EUR/toe<br />
1995 2000 2005 2006 2007 2008 2009<br />
EU-27 159.6 171.1 163.9 162.7 163.7 155.4 161.5<br />
Austria 128.5 141.6 145.9 142.5 148.2 148.7 149.7<br />
Belgium 97.9 92.4 106.9 103.0 112.0 96.4 103.3<br />
Bulgaria 429.9 40.6 51.9 50.4 66.2 71.7 72.0<br />
Cyprus 30.6 43.1 129.4 126.7 123.1 110.4 113.8<br />
Czech Republic 50.0 55.2 93.0 98.9 108.1 126.9 125.1<br />
Denmark 219.3 301.0 290.2 278.8 272.2 267.1 285.6<br />
Estonia 9.6 31.6 63.8 67.4 69.2 72.4 89.9<br />
Finland 103.1 108.7 110.6 104.4 101.8 111.8 118.4<br />
France 177.6 174.2 163.8 163.5 161.0 153.2 158.3<br />
Greece 206.1 117.3 100.4 96.5 102.3 99.5 105.8<br />
Ireland 136.5 140.7 154.0 150.1 163.8 152.0 176.5<br />
Italy 268.7 245.8 201.7 202.7 196.8 187.2 207.8<br />
Latvia 13.7 48.2 54.8 52.6 49.9 48.9 51.9<br />
Lithuania 14.9 57.9 78.4 74.5 77.5 78.5 94.9<br />
Luxembourg 173.8 164.4 174.0 161.8 161.2 166.0 166.2<br />
Hungary 111.6 79.7 85.0 82.8 93.5 92.8 N/A<br />
Malta 78.8 180.8 128.5 138.6 189.1 146.9 170.3<br />
Germany 172.4 192.7 202.2 198.1 198.5 190.7 202.8<br />
Netherlands 121.0 153.4 182.1 192.7 183.8 193.0 201.7<br />
Poland 34.7 59.0 84.5 87.6 97.6 105.3 83.8<br />
Portugal 191.4 111.8 149.2 148.3 150.4 143.8 np<br />
Romania 160.3 58.2 24.7 26.2 32.2 25.2 26.6<br />
Slovakia 40.1 42.4 64.7 67.2 76.5 84.2 80.3<br />
Slovenia 180.2 118.6 114.6 113.6 123.8 121.4 163.2<br />
Spain 147.5 137.9 119.3 119.9 117.6 114.7 122.7<br />
Sweden 140.3 179.7 196.8 199.2 196.5 188.6 178.6<br />
United Kingdom 152.3 245.8 211.5 208.5 216.7 178.7 177.4<br />
Source: Eurostat Portal Page – Sustainable Development Indicators, <strong>2012</strong>.<br />
Note: 1 Revenue from energy taxation (deflated) per unit of final energy consumption in thousand tonne of oil equivalent (toe); N/A – not available.<br />
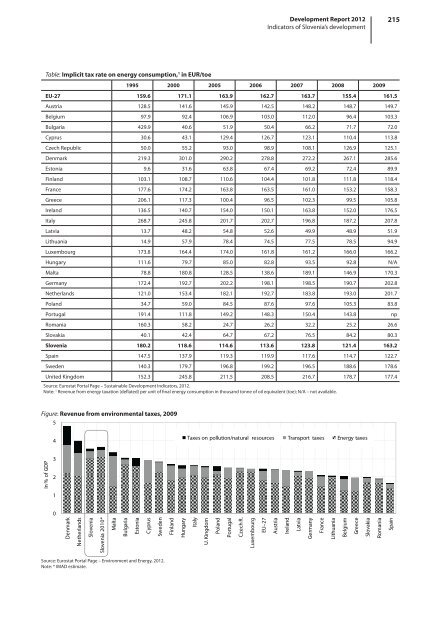
Figure: Revenue from environmental taxes, 2009<br />
5<br />
4<br />
Taxes on pollution/natural resources Transport taxes Energy taxes<br />
In % of GDP<br />
3<br />
2<br />
1<br />
0<br />
Denmark<br />
Netherlands<br />
Slovenia<br />
Slovenia 2010*<br />
Malta<br />
Bulgaria<br />
Estonia<br />
Cyprus<br />
Sweden<br />
Finland<br />
Hungary<br />
Italy<br />
U. Kingdom<br />
Poland<br />
Portugal<br />
Czech R.<br />
Luxembourg<br />
EU–27<br />
Austria<br />
Ireland<br />
Latvia<br />
Germany<br />
France<br />
Lithuania<br />
Belgium<br />
Greece<br />
Slovakia<br />
Romania<br />
Spain<br />
Source: Eurostat Portal Page – Environment and Energy, <strong>2012</strong>.<br />
Note: * IMAD estimate.


