

development report 2012 - UMAR
development report 2012 - UMAR
development report 2012 - UMAR

Create successful ePaper yourself
Turn your PDF publications into a flip-book with our unique Google optimized e-Paper software.
Development Report <strong>2012</strong><br />
Appendix<br />
247<br />
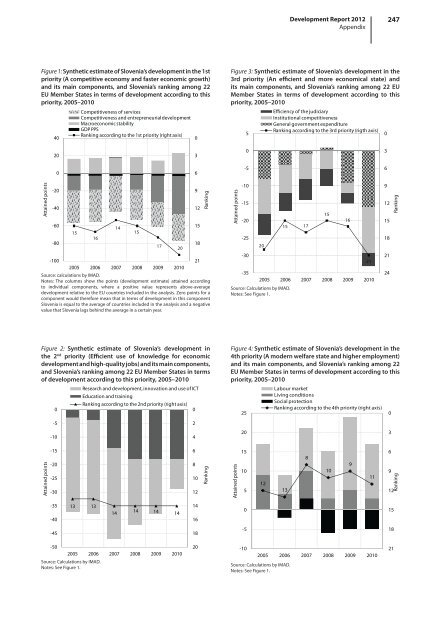
Figure 1: Synthetic estimate of Slovenia’s <strong>development</strong> in the 1st<br />
priority (A competitive economy and faster economic growth)<br />
and its main components, and Slovenia’s ranking among 22<br />
EU Member States in terms of <strong>development</strong> according to this<br />
priority, 2005–2010<br />
40<br />
Competitiveness of services<br />
Competitiveness and entrepreneurial <strong>development</strong><br />
Macroeconomic stability<br />
GDP PPS<br />
Ranking according to the 1st priority (right axis)<br />
0<br />
Figure 3: Synthetic estimate of Slovenia’s <strong>development</strong> in the<br />
3rd priority (An efficient and more economical state) and<br />
its main components, and Slovenia’s ranking among 22 EU<br />
Member States in terms of <strong>development</strong> according to this<br />
priority, 2005–2010<br />
5<br />
Efficiency of the judiciary<br />
Institutional competitiveness<br />
General government expenditure<br />
Ranking according to the 3rd priority (rigth axis)<br />
0<br />
20<br />
3<br />
0<br />
3<br />
0<br />
6<br />
-5<br />
6<br />
Attained points<br />
-20<br />
-40<br />
-60<br />
-80<br />
15<br />
16<br />
14<br />
-100<br />
21<br />
2005 2006 2007 2008 2009 2010<br />
Source: calculations by IMAD.<br />
Notes: The columns show the points (<strong>development</strong> estimate) attained according<br />
to individual components, where a positive value represents above-average<br />
<strong>development</strong> relative to the EU countries included in the analysis. Zero points for a<br />
component would therefore mean that in terms of <strong>development</strong> in this component<br />
Slovenia is equal to the average of countries included in the analysis and a negative<br />
value that Slovenia lags behind the average in a certain year.<br />
15<br />
17<br />
20<br />
9<br />
12<br />
15<br />
18<br />
Ranking<br />
Attained points<br />
-10<br />
-15<br />
-20<br />
-25<br />
-30<br />
20<br />
15 17<br />
-35<br />
2005 2006 2007 2008 2009 2010<br />
Source: Calculations by IMAD.<br />
Notes: See Figure 1.<br />
15<br />
16<br />
21<br />
9<br />
12<br />
15<br />
18<br />
21<br />
24<br />
Ranking<br />
Figure 2: Synthetic estimate of Slovenia’s <strong>development</strong> in<br />
the 2 nd priority (Efficient use of knowledge for economic<br />
<strong>development</strong> and high-quality jobs) and its main components,<br />
and Slovenia’s ranking among 22 EU Member States in terms<br />
of <strong>development</strong> according to this priority, 2005–2010<br />
Research and <strong>development</strong>, innovation and use of ICT<br />
Education and training<br />
Ranking according to the 2nd priority (right axis)<br />
0<br />
0<br />
Figure 4: Synthetic estimate of Slovenia’s <strong>development</strong> in the<br />
4th priority (A modern welfare state and higher employment)<br />
and its main components, and Slovenia’s ranking among 22<br />
EU Member States in terms of <strong>development</strong> according to this<br />
priority, 2005–2010<br />
25<br />
Labour market<br />
Living conditions<br />
Social protection<br />
Ranking according to the 4th priority (right axis)<br />
0<br />
-5<br />
2<br />
-10<br />
4<br />
20<br />
3<br />
Attained points<br />
-15<br />
-20<br />
-25<br />
-30<br />
6<br />
8<br />
10<br />
12<br />
Ranking<br />
Attained points<br />
15<br />
10<br />
5<br />
12<br />
13<br />
8<br />
10<br />
9<br />
11<br />
6<br />
9<br />
Ranking<br />
12<br />
-35<br />
-40<br />
13 13<br />
14<br />
14 14 14<br />
14<br />
16<br />
0<br />
15<br />
-45<br />
18<br />
-5<br />
18<br />
-50<br />
2005 2006 2007 2008 2009 2010<br />
Source: Calculations by IMAD.<br />
Notes: See Figure 1.<br />
20<br />
-10<br />
2005 2006 2007 2008 2009 2010<br />
Source: Calculations by IMAD.<br />
Notes: See Figure 1.<br />
21


