

development report 2012 - UMAR
development report 2012 - UMAR
development report 2012 - UMAR

You also want an ePaper? Increase the reach of your titles
YUMPU automatically turns print PDFs into web optimized ePapers that Google loves.
Development Report <strong>2012</strong><br />
Indicators of Slovenia’s <strong>development</strong><br />
199<br />
norms in upper secondary vocational and technical<br />
schools and in general upper secondary schools,<br />
which would mean a further decline in the average<br />
number of pupils per unit.<br />
Table: Pupil-teacher ratio, EU, 2000–2009<br />
Isced 1 1 Isced 2 1 Isced 3 1<br />
2000 2005 2008 2009 2000 2005 2008 2009 2000 2005 2008 2009<br />
EU 16.1 14.8 12.3 12.5 14.3 13.7 11.2 11.6 13.6 13.5 10.9 11.2<br />
Austria N/A 14.1 12.9 12.6 N/A 10.6 9.9 9.6 N/A 11.3 10.5 10.2<br />
Belgium N/A 12.8 12.6 12.5 N/A 9.4 8.1 8.1 N/A 9.9 10.8 10.2<br />
Bulgaria 16.8 16.3 16.1 17.4 12.1 12.6 12.0 12.5 11.6 11.9 11.5 12.0<br />
Cyprus 18.1 17.9 15.0 14.5 N/A 11.9 10.8 10.2 12.7 11.5 10.6 10.2<br />
Czech Rep. 21.0 17.5 18.1 18.4 15.6 13.5 11.8 11.5 13.4 12.8 14.0 12.2<br />
Denmark 10.7 11.9 10.1 9.9 10.6 N/A N/A N/A 12.1 N/A N/A N/A<br />
Estonia 14.9 N/A 16.4 16.2 11.2 N/A 16.0 15.7 10.1 N/A 12.4 16.8<br />
Finland 16.9 15.9 14.4 13.6 10.7 10.0 10.6 10.1 17.0 18.0 15.9 16.6<br />
France 19.5 19.4 19.9 19.7 14.7 14.2 14.6 14.9 10.4 10.3 9.4 9.6<br />
Germany 19.8 18.8 18.0 17.4 15.7 15.5 15.0 15.1 13.9 14.0 14.0 13.9<br />
Greece 13.4 11.1 N/A N/A 10.8 7.9 N/A N/A 10.5 8.8 N/A N/A<br />
Hungary 10.9 10.6 10.6 10.7 10.9 10.4 10.9 10.8 9.9 12.2 12.3 12.8<br />
Ireland 21.5 17.9 17.8 15.9 15.8 N/A N/A N/A 15.8 15.6 12.9 12.6<br />
Italy 11.0 10.5 10.6 10.7 10.4 10.5 9.7 10.0 10.5 12.0 11.8 11.8<br />
Latvia 18.0 12.2 12.8 11.4 12.7 11.2 9.2 8.7 13.3 12.1 11.9 11.5<br />
Lithuania 16.7 11.3 9.7 9.7 11.7 8.8 7.7 7.6 N/A N/A N/A N/A<br />
Luxembourg N/A N/A 12.1 11.6 N/A N/A 9.0 18.4 N/A 9.0 N/A 9.2<br />
Malta 19.1 12.1 10.6 9.4 9.0 8.4 7.1 6.5 16.2 17.4 15.3 15.8<br />
Netherlands 16.8 15.9 15.8 15.8 N/A N/A N/A N/A 17.1 16.2 15.8 16.1<br />
Poland 12.7 11.7 10.5 10.2 11.5 12.7 12.9 12.9 16.9 12.9 12.2 12.0<br />
Portugal 12.4 10.8 11.3 11.3 10.4 8.2 8.1 7.6 8.5 N/A 7.3 7.7<br />
Romania N/A 17.4 16.3 16.4 15.0 12.4 12.5 12.2 12.8 16.0 14.8 14.4<br />
Slovakia 18.3 18.9 18.6 17.7 13.5 14.1 14.5 14.0 12.8 14.3 15.1 15.1<br />
Slovenia 13.4 15.0 15.8 16.7 13.8 11.1 8.9 7.9 13.1 14.5 13.5 14.3<br />
Spain 14.9 14.3 13.1 13.3 13.7 12.5 10.3 10.1 9.7 8.1 8.7 9.3<br />
Sweden 12.8 12.2 12.2 12.1 12.8 12.0 11.4 11.3 15.2 14.0 14.7 13.2<br />
UK 21.2 20.7 20.2 19.9 17.6 17.0 15.0 16.1 19.3 N/A 12.4 12.3<br />
Source: Eurostat Portal Page – Population and Social Conditions, <strong>2012</strong>.<br />
Note: 1 According to the International Standard Classification of Education ISCED 1997, Isced 1 comprises primary education or the first stage of basic education, Isced 2 lower<br />
secondary or second stage of basic education and Isced 3 (upper) secondary education.<br />
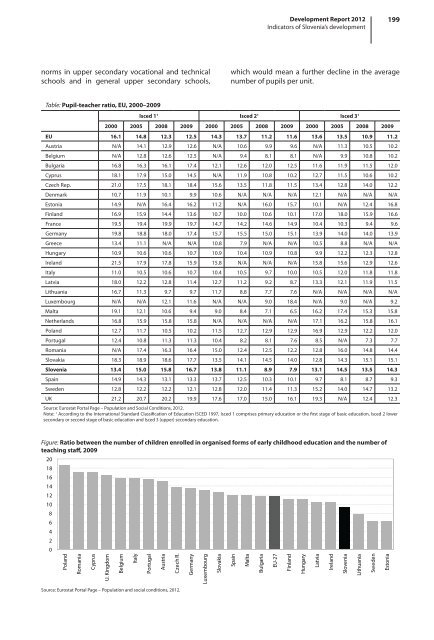
Figure: Ratio between the number of children enrolled in organised forms of early childhood education and the number of<br />
teaching staff, 2009<br />
20<br />
18<br />
16<br />
14<br />
12<br />
10<br />
8<br />
6<br />
4<br />
2<br />
0<br />
Poland<br />
Romania<br />
Cyprus<br />
U. Kingdom<br />
Belgium<br />
Italy<br />
Portugal<br />
Austria<br />
Czech R.<br />
Source: Eurostat Portal Page – Population and social conditions, <strong>2012</strong>.<br />
Germany<br />
Luxembourg<br />
Slovakia<br />
Spain<br />
Malta<br />
Bulgaria<br />
EU-27<br />
Finland<br />
Hungary<br />
Latvia<br />
Ireland<br />
Slovenia<br />
Lithuania<br />
Sweden<br />
Estonia


