

development report 2012 - UMAR
development report 2012 - UMAR
development report 2012 - UMAR

You also want an ePaper? Increase the reach of your titles
YUMPU automatically turns print PDFs into web optimized ePapers that Google loves.
Development Report <strong>2012</strong><br />
Indicators of Slovenia’s <strong>development</strong><br />
121<br />
Table: Selected indicators of entrepreneurial activity in Slovenia, 2002–2011<br />
As a % of the population aged 18–64 2002 2005 2006 2007 2008 2009 2010 2011<br />
TEA-index 1 4.6 4.4 4.6 4.8 6.4 5.4 4.7 3.7<br />
TEA-nascent entrepreneurs 2 3.3 3.0 2.9 3.0 4.1 3.2 2.2 1.9<br />
TEA-new entrepreneurs 3 1.5 1.4 1.8 1.8 2.4 2.1 2.4 1.8<br />
TEA-opportunity 4 3.3 3.8 4.0 4.2 5.6 4.7 3.7 3.0<br />
TEA-necessity 5 1.4 0.5 0.5 0.5 0.8 0.5 0.8 0.4<br />
Established business 6 - 6.3 4.4 4.6 5.6 5.7 4.9 4.8<br />
Overall entrepreneurial activity 7 - 10.1 9.0 9.3 11.8 10.8 9.5 8.4<br />
Sources: Rebernik et al., 2002; Rebernik et al., 2004; Rebernik et al., 2005; Rebernik et al., 2006; Rebernik et al., 2007; Rebernik et al., 2008; Rebernik et al., 2009; Rebernik et al., 2010;<br />
Rebernik et al., 2011, Kelley et al., <strong>2012</strong>.<br />
Notes: 1 The TEA-index is the rate of total early-stage entrepreneurial activity measuring the share of the population engaging in entrepreneurship. It includes individuals who<br />
have started setting up new businesses or engaging in new business activities, including self-employment 2 TEA-nascent entrepreneurs who have paid wages or salaries for no<br />
more than three months. It also includes individuals employed as owners/managers of new businesses who have been paying salaries for no longer than 42 months. 3 TEA new<br />
entrepreneurs. 4 TEA-opportunity measures the share of the population who engage in entrepreneurial activity to exploit a perceived business opportunity. 5 TEA-necessity<br />
measures the share of the population who have set up a business out of necessity. 6 Established business represents the share of people who own a firm that has been operating<br />
for more than 42 months. 7 The overall entrepreneurial activity includes the TEA index and the share of established business.<br />
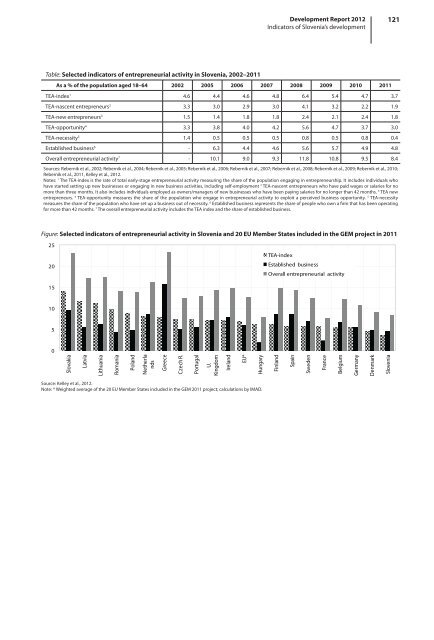
Figure: Selected indicators of entrepreneurial activity in Slovenia and 20 EU Member States included in the GEM project in 2011<br />
25<br />
20<br />
TEA-index<br />
Established business<br />
Overall entrepreneurial activity<br />
15<br />
10<br />
5<br />
0<br />
Slovakia<br />
Latvia<br />
Lithuania<br />
Romania<br />
Poland<br />
Netherla<br />
nds<br />
Greece<br />
Czech R.<br />
Portugal<br />
U.<br />
Kingdom<br />
Ireland<br />
EU*<br />
Hungary<br />
Finland<br />
Spain<br />
Sweden<br />
France<br />
Belgium<br />
Germany<br />
Denmark<br />
Slovenia<br />
Source: Kelley et al., <strong>2012</strong>.<br />
Note: * Weighted average of the 20 EU Member States included in the GEM 2011 project; calculations by IMAD.


