

development report 2012 - UMAR
development report 2012 - UMAR
development report 2012 - UMAR

You also want an ePaper? Increase the reach of your titles
YUMPU automatically turns print PDFs into web optimized ePapers that Google loves.
Development Report <strong>2012</strong><br />
Indicators of Slovenia’s <strong>development</strong><br />
161<br />
Table: Economic structure of taxes and social security contributions, 2005 and 2009, as a % of GDP<br />
Total Taxes on consumption Taxes on labour Taxes on capital<br />
2005 2009 2005 2009 2005 2009 2005 2009<br />
EU-27 39.1 38.4 11.1 10.6 19.6 20.0 8.6 7.9<br />
Austria 42.3 42.7 12.2 12.0 23.4 24.2 6.8 6.5<br />
Belgium 44.9 43.5 11.1 10.6 23.8 23.7 9.9 9.0<br />
Bulgaria 31.3 28.9 15.8 14.7 11.8 9.9 3.6 4.3<br />
Cyprus 35.5 35.1 15.2 13.4 11.3 12.2 9.0 9.5<br />
Czech Republic 37.1 34.5 11.3 11.2 19.1 17.5 6.8 5.8<br />
Denmark 50.8 48.1 16.2 15.2 24.8 27.1 10.0 5.9<br />
Estonia 30.6 35.9 12.8 14.6 15.4 18.7 2.4 2.6<br />
Finland 43.9 43.1 13.7 13.4 23.2 23.8 7.1 5.9<br />
France 43.5 41.6 11.2 10.6 23.0 22.8 9.5 8.4<br />
Greece 31.9 30.3 11.2 10.8 12.9 12.5 7.8 7.1<br />
Ireland 30.7 28.2 11.4 10.0 10.4 11.8 8.9 6.5<br />
Italy 40.4 43.1 10.0 9.8 20.4 22.1 10.0 11.2<br />
Latvia 29.0 26.6 12.1 10.2 14.0 13.8 2.8 2.5<br />
Lithuania 28.5 29.3 10.8 11.2 14.5 15.1 3.3 3.3<br />
Luxembourg 37.6 37.1 10.9 10.2 15.4 16.4 11.3 10.5<br />
Hungary 37.5 39.5 14.5 15.0 18.3 19.7 4.6 4.7<br />
Malta 33.7 34.2 14.4 13.5 10.2 9.8 9.1 10.9<br />
Germany 38.8 39.7 10.1 11.1 22.6 22.7 6.0 5.9<br />
Netherlands 37.6 38.2 12.0 11.8 18.2 20.9 7.4 5.5<br />
Poland 32.8 31.8 12.3 11.5 12.8 12.1 8.0 8.2<br />
Portugal 31.5 31.0 12.9 10.9 12.2 13.0 6.5 7.1<br />
Romania 27.8 27.0 12.3 10.3 11.0 11.9 4.5 4.8<br />
Slovakia 31.3 28.8 12.3 10.3 12.5 12.5 6.5 5.9<br />
Slovenia 38.6 37.6 13.4 14.0 20.6 19.6 4.7 4.1<br />
Spain 35.6 30.4 9.8 7.2 16.2 16.7 10.1 7.4<br />
Sweden 48.9 46.9 12.6 13.3 29.1 27.4 7.2 6.1<br />
United Kingdom 36.0 34.9 11.2 10.4 14.3 14.0 10.7 10.5<br />
Source: Taxation trends in the European Union (Eurostat, European Commission), 2011.<br />
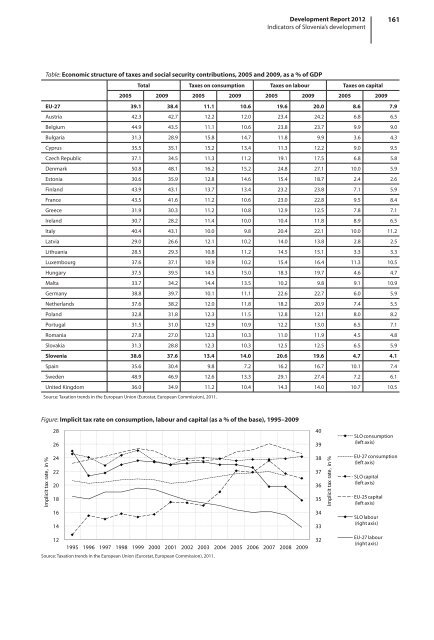
Figure: Implicit tax rate on consumption, labour and capital (as a % of the base), 1995–2009<br />
Implicit tax rate, in %<br />
28<br />
26<br />
24<br />
22<br />
20<br />
18<br />
16<br />
14<br />
12<br />
1995 1996 1997 1998 1999 2000 2001 2002 2003 2004 2005 2006 2007 2008 2009<br />
Source: Taxation trends in the European Union (Eurostat, European Commission), 2011.<br />
40<br />
39<br />
38<br />
37<br />
36<br />
35<br />
34<br />
33<br />
32<br />
Implicit tax rate, in %<br />
SLO consumption<br />
(left axis)<br />
EU-27 consumption<br />
(left axis)<br />
SLO capital<br />
(left axis)<br />
EU-25 capital<br />
(left axis)<br />
SLO labour<br />
(right axis)<br />
EU-27 labour<br />
(right axis)


