

development report 2012 - UMAR
development report 2012 - UMAR
development report 2012 - UMAR

Create successful ePaper yourself
Turn your PDF publications into a flip-book with our unique Google optimized e-Paper software.
28 Development Report <strong>2012</strong><br />
Development by the priorities of SDS – A competitive economy and faster economic growth<br />
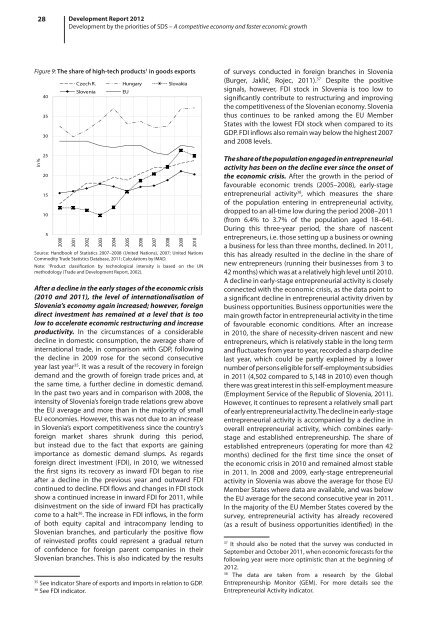
Figure 9: The share of high-tech products 1 in goods exports<br />
In %<br />
40<br />
35<br />
30<br />
25<br />
20<br />
15<br />
10<br />
5<br />
2000<br />
2001<br />
Czech R. Hungary Slovakia<br />
Slovenia<br />
EU<br />
2002<br />
2003<br />
2004<br />
Source: Handbook of Statistics 2007–2008 (United Nations), 2007; United Nations<br />
Commodity Trade Statistics Database, 2011; Calculations by IMAD.<br />
Note: 1<br />
Product classification by technological intensity is based on the UN<br />
methodology (Trade and Development Report, 2002).<br />
After a decline in the early stages of the economic crisis<br />
(2010 and 2011), the level of internationalisation of<br />
Slovenia’s economy again increased; however, foreign<br />
direct investment has remained at a level that is too<br />
low to accelerate economic restructuring and increase<br />
productivity. In the circumstances of a considerable<br />
decline in domestic consumption, the average share of<br />
international trade, in comparison with GDP, following<br />
the decline in 2009 rose for the second consecutive<br />
year last year 35 . It was a result of the recovery in foreign<br />
demand and the growth of foreign trade prices and, at<br />
the same time, a further decline in domestic demand.<br />
In the past two years and in comparison with 2008, the<br />
intensity of Slovenia’s foreign trade relations grew above<br />
the EU average and more than in the majority of small<br />
EU economies. However, this was not due to an increase<br />
in Slovenia’s export competitiveness since the country’s<br />
foreign market shares shrunk during this period,<br />
but instead due to the fact that exports are gaining<br />
importance as domestic demand slumps. As regards<br />
foreign direct investment (FDI), in 2010, we witnessed<br />
the first signs its recovery as inward FDI began to rise<br />
after a decline in the previous year and outward FDI<br />
continued to decline. FDI flows and changes in FDI stock<br />
show a continued increase in inward FDI for 2011, while<br />
disinvestment on the side of inward FDI has practically<br />
come to a halt 36 . The increase in FDI inflows, in the form<br />
of both equity capital and intracompany lending to<br />
Slovenian branches, and particularly the positive flow<br />
of reinvested profits could represent a gradual return<br />
of confidence for foreign parent companies in their<br />
Slovenian branches. This is also indicated by the results<br />
35<br />
See indicator Share of exports and imports in relation to GDP.<br />
36<br />
See FDI indicator.<br />
2005<br />
2006<br />
2007<br />
2008<br />
2009<br />
2010<br />
of surveys conducted in foreign branches in Slovenia<br />
(Burger, Jaklič, Rojec, 2011). 37 Despite the positive<br />
signals, however, FDI stock in Slovenia is too low to<br />
significantly contribute to restructuring and improving<br />
the competitiveness of the Slovenian economy. Slovenia<br />
thus continues to be ranked among the EU Member<br />
States with the lowest FDI stock when compared to its<br />
GDP. FDI inflows also remain way below the highest 2007<br />
and 2008 levels.<br />
The share of the population engaged in entrepreneurial<br />
activity has been on the decline ever since the onset of<br />
the economic crisis. After the growth in the period of<br />
favourable economic trends (2005–2008), early-stage<br />
entrepreneurial activity 38 , which measures the share<br />
of the population entering in entrepreneurial activity,<br />
dropped to an all-time low during the period 2008–2011<br />
(from 6.4% to 3.7% of the population aged 18–64).<br />
During this three-year period, the share of nascent<br />
entrepreneurs, i.e. those setting up a business or owning<br />
a business for less than three months, declined. In 2011,<br />
this has already resulted in the decline in the share of<br />
new entrepreneurs (running their businesses from 3 to<br />
42 months) which was at a relatively high level until 2010.<br />
A decline in early-stage entrepreneurial activity is closely<br />
connected with the economic crisis, as the data point to<br />
a significant decline in entrepreneurial activity driven by<br />
business opportunities. Business opportunities were the<br />
main growth factor in entrepreneurial activity in the time<br />
of favourable economic conditions. After an increase<br />
in 2010, the share of necessity-driven nascent and new<br />
entrepreneurs, which is relatively stable in the long term<br />
and fluctuates from year to year, recorded a sharp decline<br />
last year, which could be partly explained by a lower<br />
number of persons eligible for self-employment subsidies<br />
in 2011 (4,502 compared to 5,148 in 2010) even though<br />
there was great interest in this self-employment measure<br />
(Employment Service of the Republic of Slovenia, 2011).<br />
However, it continues to represent a relatively small part<br />
of early entrepreneurial activity. The decline in early-stage<br />
entrepreneurial activity is accompanied by a decline in<br />
overall entrepreneurial activity, which combines earlystage<br />
and established entrepreneurship. The share of<br />
established entrepreneurs (operating for more than 42<br />
months) declined for the first time since the onset of<br />
the economic crisis in 2010 and remained almost stable<br />
in 2011. In 2008 and 2009, early-stage entrepreneurial<br />
activity in Slovenia was above the average for those EU<br />
Member States where data are available, and was below<br />
the EU average for the second consecutive year in 2011.<br />
In the majority of the EU Member States covered by the<br />
survey, entrepreneurial activity has already recovered<br />
(as a result of business opportunities identified) in the<br />
37<br />
It should also be noted that the survey was conducted in<br />
September and October 2011, when economic forecasts for the<br />
following year were more optimistic than at the beginning of<br />
<strong>2012</strong>.<br />
38<br />
The data are taken from a research by the Global<br />
Entrepreneurship Monitor (GEM). For more details see the<br />
Entrepreneurial Activity indicator.


