

development report 2012 - UMAR
development report 2012 - UMAR
development report 2012 - UMAR

Create successful ePaper yourself
Turn your PDF publications into a flip-book with our unique Google optimized e-Paper software.
Development Report <strong>2012</strong><br />
Indicators of Slovenia’s <strong>development</strong><br />
205<br />
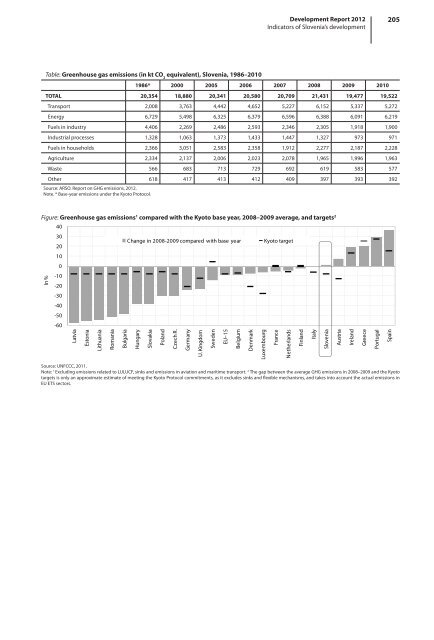
Table: Greenhouse gas emissions (in kt CO 2<br />
equivalent), Slovenia, 1986–2010<br />
1986* 2000 2005 2006 2007 2008 2009 2010<br />
TOTAL 20,354 18,880 20,341 20,580 20,709 21,431 19,477 19,522<br />
Transport 2,008 3,763 4,442 4,652 5,227 6,152 5,337 5,272<br />
Energy 6,729 5,498 6,325 6,379 6,596 6,388 6,091 6,219<br />
Fuels in industry 4,406 2,269 2,486 2,593 2,346 2,305 1,918 1,900<br />
Industrial processes 1,328 1,063 1,373 1,433 1,447 1,327 973 971<br />
Fuels in households 2,366 3,051 2,583 2,358 1,912 2,277 2,187 2,228<br />
Agriculture 2,334 2,137 2,006 2,023 2,078 1,965 1,996 1,963<br />
Waste 566 683 713 729 692 619 583 577<br />
Other 618 417 413 412 409 397 393 392<br />
Source: ARSO. Report on GHG emissions, <strong>2012</strong>.<br />
Note. * Base-year emissions under the Kyoto Protocol.<br />
Figure: Greenhouse gas emissions 1 compared with the Kyoto base year, 2008–2009 average, and targets 2<br />
40<br />
30<br />
20<br />
Change in 2008-2009 compared with base year<br />
Kyoto target<br />
10<br />
0<br />
-10<br />
-20<br />
-30<br />
-40<br />
-50<br />
-60<br />
Latvia<br />
Estonia<br />
Lithuania<br />
Romania<br />
Bulgaria<br />
Hungary<br />
Slovakia<br />
Poland<br />
Czech R.<br />
Germany<br />
U. Kingdom<br />
Sweden<br />
EU–15<br />
Belgium<br />
Denmark<br />
Luxembourg<br />
France<br />
Netherlands<br />
Finland<br />
Italy<br />
Slovenia<br />
Austria<br />
Ireland<br />
Greece<br />
Portugal<br />
Spain<br />
In %<br />
Source: UNFCCC, 2011.<br />
Note: 1 Excluding emissions related to LULUCF, sinks and emissions in aviation and maritime transport. 2 The gap between the average GHG emissions in 2008–2009 and the Kyoto<br />
targets is only an approximate estimate of meeting the Kyoto Protocol commitments, as it excludes sinks and flexible mechanisms, and takes into account the actual emissions in<br />
EU ETS sectors.


