

development report 2012 - UMAR
development report 2012 - UMAR
development report 2012 - UMAR

You also want an ePaper? Increase the reach of your titles
YUMPU automatically turns print PDFs into web optimized ePapers that Google loves.
Development Report <strong>2012</strong><br />
Indicators of Slovenia’s <strong>development</strong><br />
141<br />
Table: Share of private expenditure on all levels of formal education, EU-27, 1999–2008, in %<br />
1999 2000 2005 2006 2007 2008<br />
EU-27 12.2 11.5 12.7 12.6 13.5 13.8<br />
Austria 5.1 5.8 8.6 10.8 9.0 9.2<br />
Belgium 5.0 7.9 5.8 5.6 5.6 5.7<br />
Bulgaria 12.7 14.7 13.9 15.2 15.0 12.8<br />
Cyprus 34.0 34.9 16.7 16.6 17.5 17.3<br />
Czech Republic 12.4 10.1 12.4 11.1 11.3 12.7<br />
Denmark 4.0 4.0 7.7 8.1 7.5 7.8<br />
Estonia N/A N/A N/A N/A 6.5 5.3<br />
Finland 2.2 2.0 2.2 2.5 2.5 2.6<br />
France 8.1 8.8 9.2 9.1 9.0 10.0<br />
Greece 6.7 6.2 6.0 N/A N/A N/A<br />
Ireland 7.3 7.0 6.3 6.2 5.2 6.2<br />
Italy 9.7 9.1 9.5 7.7 8.9 8.6<br />
Latvia 9.8 11.1 13.8 12.0 10.4 9.9<br />
Lithuania N/A N/A 9.8 9.2 9.3 9.9<br />
Hungary 12.1 11.7 8.7 9.5 N/A N/A<br />
Malta 6.1 10.6 5.3 N/A 5.7 5.0<br />
Germany 19.2 18.9 18.0 14.8 14.6 14.6<br />
Netherlands 16.3 15.9 16.0 15.7 16.2 16.4<br />
Poland 3.1 N/A 9.3 9.5 9.4 12.9<br />
Portugal 1.3 1.4 7.4 8.0 8.3 9.5<br />
Romania 9.8 8.3 N/A N/A 10.8 N/A<br />
Slovakia 2.2 3.6 16.1 14.8 13.8 17.5<br />
Slovenia 13.9 14.9 13.0 12.8 13.1 11.6<br />
Spain 17.7 12.6 11.4 11.1 12.7 12.9<br />
Sweden 3.0 3.0 3.0 2.7 2.6 2.7<br />
United Kingdom 16.3 14.8 19.9 24.7 30.5 30.5<br />
Source: Eurostat Portal Page – Population and Social conditions, <strong>2012</strong>; Expenditure on formal education, Slovenia, 2005 – 2008 – final data – revision − SORS (2011); Expenditure<br />
on formal education, 2009 – provisional data − SORS (2011). Expenditure on formal education, 1995 – 2003 SORS (2006).<br />
Note: Data for Luxembourg not available: N/A – not available.<br />
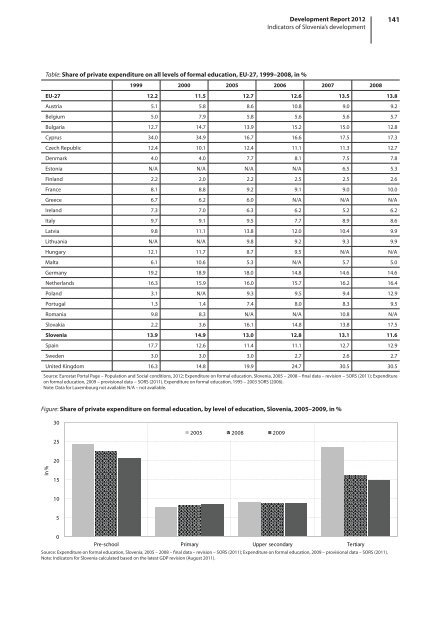
Figure: Share of private expenditure on formal education, by level of education, Slovenia, 2005–2009, in %<br />
30<br />
25<br />
2005 2008 2009<br />
20<br />
In %<br />
15<br />
10<br />
5<br />
0<br />
Pre-school Primary Upper secondary Tertiary<br />
Source: Expenditure on formal education, Slovenia, 2005 – 2008 – final data – revision – SORS (2011); Expenditure on formal education, 2009 – provisional data – SORS (2011).<br />
Note: Indicators for Slovenia calculated based on the latest GDP revision (August 2011).


