

development report 2012 - UMAR
development report 2012 - UMAR
development report 2012 - UMAR

Create successful ePaper yourself
Turn your PDF publications into a flip-book with our unique Google optimized e-Paper software.
58 Development Report <strong>2012</strong><br />
Development by the priorities of SDS – A modern welfare state and higher employment<br />
Over the last year, the participation in lifelong learning<br />
dropped, with the rates of participation of the elderly<br />
and low-skilled people remaining particularly low 155 .<br />
The issue of increased labour market segmentation<br />
poses a great challenge in the labour market policy and<br />
the promotion of flexicurity. To deal with this issue, it<br />
would be necessary (i) to reduce substantial differences<br />
in the rights arising from fixed-term and permanent<br />
employment, and (ii) to regulate student work in a<br />
different manner.<br />
4.2. Modernisation of the social<br />
protection systems<br />
Social protection expenditure 156 is increasing, and<br />
so are the problems for funding it. In 2009 (the latest<br />
available data) this expenditure increased by 6.6% 157 in<br />
real terms, which by far exceeded the average recorded in<br />
some previous years (3%). This high increase can largely<br />
be attributed to the growth of pension expenditure (by<br />
7.2%) and the expenditure on various social transfers that<br />
in 2009 began to increase rapidly due to the economic<br />
crisis, as well as to expenditure growth in health care<br />
as a result of the public sector wage reform. Expressed<br />
as a share of GDP, the increase in the social protection<br />
expenditure was also quite substantial (to 24.2% of<br />
GDP, which is almost 3 p.p. more than the year before).<br />
Alongside expenditure growth, this situation was also the<br />
result of a substantial GDP decline in 2009. Since similar<br />
trends were also typical of other EU Member States, the<br />
share of the social protection expenditure continues<br />
to remain substantially below the EU average (29.5%).<br />
Despite the applicability of intervention measures in<br />
2010 and 2011 that restricted the growth of expenditure<br />
for cash allowances under the social protection<br />
programmes 158 , these allowances continued to increase<br />
in real terms owing to further rise in the number of<br />
pensioners and the beneficiaries of certain social<br />
transfers (mostly because of increased unemployment).<br />
Given a modest economic growth, this trend is expected<br />
to result in a further increase in its share against the GDP.<br />
The problems of providing public resources to cover<br />
this expenditure have been escalating year by year.<br />
The volume of transfers from the state budget to the<br />
pension fund to cover pension expenditure is increasing,<br />
while the revenues of the healthcare fund in 2011 did<br />
not suffice to cover current liabilities for the third year<br />
in a row. Out of many systemic changes expected to be<br />
implemented for quite a while, the reform of the system<br />
of means-tested social transfers was the only one that<br />
Slovenia began to implement in <strong>2012</strong>. This reform aims<br />
at achieving more target-oriented transfers which under<br />
the new regulation do not only depend on the income<br />
but also on the property of potential beneficiaries.<br />
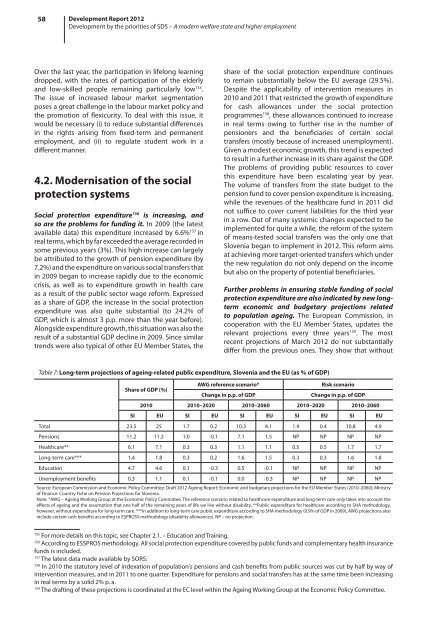
Further problems in ensuring stable funding of social<br />
protection expenditure are also indicated by new longterm<br />
economic and budgetary projections related<br />
to population ageing. The European Commission, in<br />
cooperation with the EU Member States, updates the<br />
relevant projections every three years 159 . The most<br />
recent projections of March <strong>2012</strong> do not substantially<br />
differ from the previous ones. They show that without<br />
Table 7: Long-term projections of ageing-related public expenditure, Slovenia and the EU (as % of GDP)<br />
Share of GDP (%)<br />
AWG reference scenario*<br />
Change in p.p. of GDP<br />
Risk scenario<br />
Change in p.p. of GDP<br />
2010 2010–2020 2010–2060 2010–2020 2010–2060<br />
SI EU SI EU SI EU SI EU SI EU<br />
Total 23.5 25 1.7 0.2 10.3 4.1 1.9 0.4 10.8 4.9<br />
Pensions 11.2 11.3 1.0 -0.1 7.1 1.5 NP NP NP NP<br />
Healthcare** 6.1 7.1 0.3 0.3 1.1 1.1 0.5 0.5 1.7 1.7<br />
Long-term care*** 1.4 1.8 0.3 0.2 1.6 1.5 0.3 0.3 1.6 1.8<br />
Education 4.7 4.6 0.1 -0.3 0.5 -0.1 NP NP NP NP<br />
Unemployment benefits 0.3 1.1 0.1 -0.1 0.0 -0.3 NP NP NP NP<br />
Source: European Commission and Economic Policy Committee: Draft <strong>2012</strong> Ageing Report: Economic and budgetary projections for the EU Member States (2010–2060); Ministry<br />
of Finance: Country Fiche on Pension Projections for Slovenia.<br />
Note: *AWG – Ageing Working Group at the Economic Policy Committee. The reference scenario related to healthcare expenditure and long-term care only takes into account the<br />
effects of ageing and the assumption that one half of the remaining years of life we live without disability. **Public expenditure for healthcare according to SHA methodology,<br />
however, without expenditure for long-term care. ***In addition to long-term care public expenditure according to SHA methodology (0.9% of GDP in 2009), AWG projections also<br />
include certain cash benefits according to ESPROSS methodology (disability allowances). NP – no projection.<br />
155<br />
For more details on this topic, see Chapter 2.1. – Education and Training.<br />
156<br />
According to ESSPROS methodology. All social protection expenditure covered by public funds and complementary health insurance<br />
funds is included.<br />
157<br />
The latest data made available by SORS.<br />
158<br />
In 2010 the statutory level of indexation of population's pensions and cash benefits from public sources was cut by half by way of<br />
intervention measures, and in 2011 to one quarter. Expenditure for pensions and social transfers has at the same time been increasing<br />
in real terms by a solid 2% p. a.<br />
159<br />
The drafting of these projections is coordinated at the EC level within the Ageing Working Group at the Economic Policy Committee.


