

development report 2012 - UMAR
development report 2012 - UMAR
development report 2012 - UMAR

You also want an ePaper? Increase the reach of your titles
YUMPU automatically turns print PDFs into web optimized ePapers that Google loves.
Development Report <strong>2012</strong><br />
Development by the priorities of SDS – Integration of measures to achieve sustainable <strong>development</strong><br />
79<br />
municipal waste management, but Slovenia is still far<br />
from achieving the targets set for <strong>2012</strong> 269 . In managing<br />
waste from production and service activities, relatively<br />
favourable trends continued in 2010, since most of this<br />
waste (approx. 80%) 270 was recovered. After a longer<br />
period of increased quantities of waste generated by<br />
these activities, their volumes decreased under the<br />
impact of the economic crisis in 2009 and 2010. In 2010<br />
almost 90% of the waste generated by production and<br />
service activities was in three sectors: the construction<br />
sector (31.3%), electricity, gas and steam supply<br />
(28.1%), and manufacturing industries (28.0%). During<br />
the period 2005–2010, the pressure increasing the<br />
quantities of industrial waste was produced particularly<br />
by construction and demolition waste. During the<br />
period under analysis, such waste increased by almost<br />
40%. Despite a considerable reduction in construction<br />
activities, the waste from these activities also rose in<br />
2010. Although construction waste has high recycling<br />
potential, less than half of the waste generated was<br />
recovered in this manner 271 . Reused, not-landfilled, waste<br />
reduces the pressures on the environment by providing<br />
space for landfill. Waste is also an important source of<br />
secondary raw materials and their recovery also reduces<br />
the pressure on the use of these natural resources. The<br />
increasing prices of raw materials on the world markets<br />
serve as an incentive for better use of secondary raw<br />
materials from waste, and tax instruments may also have<br />
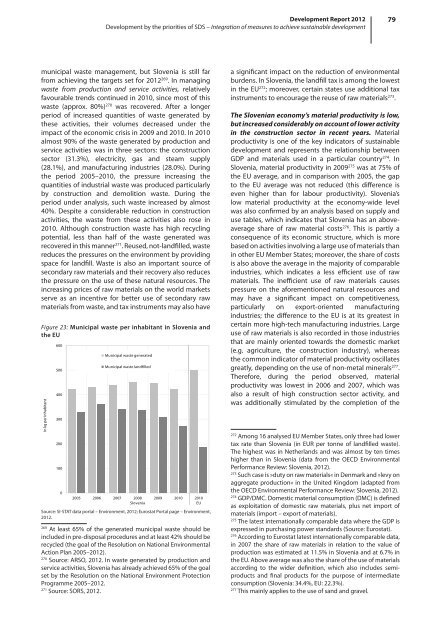
Figure 23: Municipal waste per inhabitant in Slovenia and<br />
the EU<br />
In kg per inhabitant<br />
600<br />
500<br />
400<br />
300<br />
200<br />
100<br />
0<br />
Municipal waste generated<br />
Municipal waste landfilled<br />
2005 2006 2007 2008<br />
Slovenia<br />
2009 2010 2010<br />
EU<br />
Source: SI-STAT data portal – Environment, <strong>2012</strong>; Eurostat Portal page – Environment,<br />
<strong>2012</strong>.<br />
269<br />
At least 65% of the generated municipal waste should be<br />
included in pre-disposal procedures and at least 42% should be<br />
recycled (the goal of the Resolution on National Environmental<br />
Action Plan 2005–<strong>2012</strong>).<br />
270<br />
Source: ARSO, <strong>2012</strong>. In waste generated by production and<br />
service activities, Slovenia has already achieved 65% of the goal<br />
set by the Resolution on the National Environment Protection<br />
Programme 2005–<strong>2012</strong>.<br />
271<br />
Source: SORS, <strong>2012</strong>.<br />
a significant impact on the reduction of environmental<br />
burdens. In Slovenia, the landfill tax is among the lowest<br />
in the EU 272 ; moreover, certain states use additional tax<br />
instruments to encourage the reuse of raw materials 273 .<br />
The Slovenian economy’s material productivity is low,<br />
but increased considerably on account of lower activity<br />
in the construction sector in recent years. Material<br />
productivity is one of the key indicators of sustainable<br />
<strong>development</strong> and represents the relationship between<br />
GDP and materials used in a particular country 274 . In<br />
Slovenia, material productivity in 2009 275 was at 75% of<br />
the EU average, and in comparison with 2005, the gap<br />
to the EU average was not reduced (this difference is<br />
even higher than for labour productivity). Slovenia’s<br />
low material productivity at the economy-wide level<br />
was also confirmed by an analysis based on supply and<br />
use tables, which indicates that Slovenia has an aboveaverage<br />
share of raw material costs 276 . This is partly a<br />
consequence of its economic structure, which is more<br />
based on activities involving a large use of materials than<br />
in other EU Member States; moreover, the share of costs<br />
is also above the average in the majority of comparable<br />
industries, which indicates a less efficient use of raw<br />
materials. The inefficient use of raw materials causes<br />
pressure on the aforementioned natural resources and<br />
may have a significant impact on competitiveness,<br />
particularly on export-oriented manufacturing<br />
industries; the difference to the EU is at its greatest in<br />
certain more high-tech manufacturing industries. Large<br />
use of raw materials is also recorded in those industries<br />
that are mainly oriented towards the domestic market<br />
(e.g. agriculture, the construction industry), whereas<br />
the common indicator of material productivity oscillates<br />
greatly, depending on the use of non-metal minerals 277 .<br />
Therefore, during the period observed, material<br />
productivity was lowest in 2006 and 2007, which was<br />
also a result of high construction sector activity, and<br />
was additionally stimulated by the completion of the<br />
272<br />
Among 16 analysed EU Member States, only three had lower<br />
tax rate than Slovenia (in EUR per tonne of landfilled waste).<br />
The highest was in Netherlands and was almost by ten times<br />
higher than in Slovenia (data from the OECD Environmental<br />
Performance Review: Slovenia, <strong>2012</strong>).<br />
273<br />
Such case is »duty on raw materials« in Denmark and »levy on<br />
aggregate production« in the United Kingdom (adapted from<br />
the OECD Environmental Performance Review: Slovenia, <strong>2012</strong>).<br />
274<br />
GDP/DMC. Domestic material consumption (DMC) is defined<br />
as exploitation of domestic raw materials, plus net import of<br />
materials (import – export of materials).<br />
275<br />
The latest internationally comparable data where the GDP is<br />
expressed in purchasing power standards (Source: Eurostat).<br />
276<br />
According to Eurostat latest internationally comparable data,<br />
in 2007 the share of raw materials in relation to the value of<br />
production was estimated at 11.5% in Slovenia and at 6.7% in<br />
the EU. Above average was also the share of the use of materials<br />
according to the wider definition, which also includes semiproducts<br />
and final products for the purpose of intermediate<br />
consumption (Slovenia: 34.4%, EU: 22.3%).<br />
277<br />
This mainly applies to the use of sand and gravel.


