

development report 2012 - UMAR
development report 2012 - UMAR
development report 2012 - UMAR

Create successful ePaper yourself
Turn your PDF publications into a flip-book with our unique Google optimized e-Paper software.
36 Development Report <strong>2012</strong><br />
Development by the priorities of SDS – A competitive economy and faster economic growth<br />
Box 5: Private sector borrowing and debt (internal imbalance indicators in excessive imbalance assessment<br />
procedures in the EU) - continue<br />
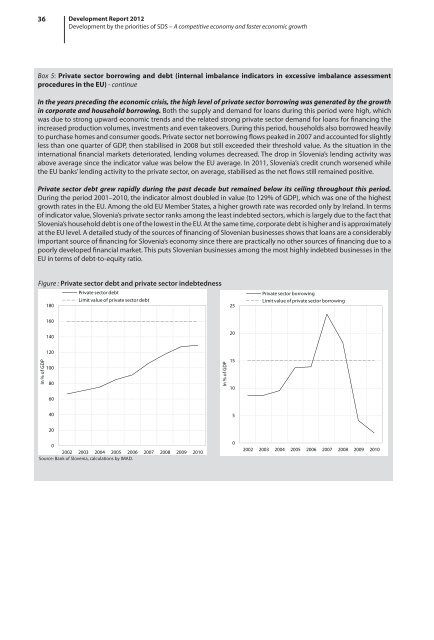
In the years preceding the economic crisis, the high level of private sector borrowing was generated by the growth<br />
in corporate and household borrowing. Both the supply and demand for loans during this period were high, which<br />
was due to strong upward economic trends and the related strong private sector demand for loans for financing the<br />
increased production volumes, investments and even takeovers. During this period, households also borrowed heavily<br />
to purchase homes and consumer goods. Private sector net borrowing flows peaked in 2007 and accounted for slightly<br />
less than one quarter of GDP, then stabilised in 2008 but still exceeded their threshold value. As the situation in the<br />
international financial markets deteriorated, lending volumes decreased. The drop in Slovenia’s lending activity was<br />
above average since the indicator value was below the EU average. In 2011, Slovenia’s credit crunch worsened while<br />
the EU banks’ lending activity to the private sector, on average, stabilised as the net flows still remained positive.<br />
Private sector debt grew rapidly during the past decade but remained below its ceiling throughout this period.<br />
During the period 2001–2010, the indicator almost doubled in value (to 129% of GDP), which was one of the highest<br />
growth rates in the EU. Among the old EU Member States, a higher growth rate was recorded only by Ireland. In terms<br />
of indicator value, Slovenia’s private sector ranks among the least indebted sectors, which is largely due to the fact that<br />
Slovenia’s household debt is one of the lowest in the EU. At the same time, corporate debt is higher and is approximately<br />
at the EU level. A detailed study of the sources of financing of Slovenian businesses shows that loans are a considerably<br />
important source of financing for Slovenia’s economy since there are practically no other sources of financing due to a<br />
poorly developed financial market. This puts Slovenian businesses among the most highly indebted businesses in the<br />
EU in terms of debt-to-equity ratio.<br />
Figure : Private sector debt and private sector indebtedness<br />
Private sector debt<br />
Limit value of private sector debt<br />
180<br />
25<br />
Private sector borrowing<br />
Limit value of private sector borrowing<br />
160<br />
140<br />
20<br />
In % of GDP<br />
120<br />
100<br />
80<br />
In % of GDP<br />
15<br />
10<br />
60<br />
40<br />
5<br />
20<br />
0<br />
2002 2003 2004 2005 2006 2007 2008 2009 2010<br />
Source: Bank of Slovenia, calculations by IMAD.<br />
0<br />
2002 2003 2004 2005 2006 2007 2008 2009 2010


