

development report 2012 - UMAR
development report 2012 - UMAR
development report 2012 - UMAR

Create successful ePaper yourself
Turn your PDF publications into a flip-book with our unique Google optimized e-Paper software.
60 Development Report <strong>2012</strong><br />
Development by the priorities of SDS – A modern welfare state and higher employment<br />
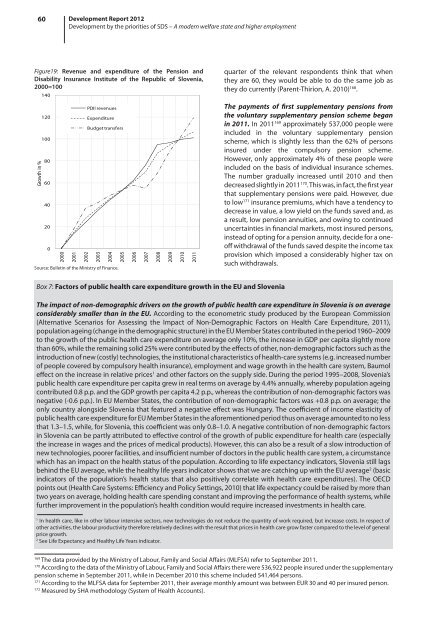
Figure19: Revenue and expenditure of the Pension and<br />
Disability Insurance Institute of the Republic of Slovenia,<br />
2000=100<br />
Growth in %<br />
140<br />
120<br />
100<br />
80<br />
60<br />
40<br />
20<br />
0<br />
2000<br />
2001<br />
PDII revenues<br />
Expenditure<br />
Budget transfers<br />
2002<br />
2003<br />
2004<br />
Source: Bulletin of the Ministry of Finance.<br />
2005<br />
2006<br />
2007<br />
2008<br />
2009<br />
2010<br />
2011<br />
quarter of the relevant respondents think that when<br />
they are 60, they would be able to do the same job as<br />
they do currently (Parent-Thirion, A. 2010) 168 .<br />
The payments of first supplementary pensions from<br />
the voluntary supplementary pension scheme began<br />
in 2011. In 2011 169 approximately 537,000 people were<br />
included in the voluntary supplementary pension<br />
scheme, which is slightly less than the 62% of persons<br />
insured under the compulsory pension scheme.<br />
However, only approximately 4% of these people were<br />
included on the basis of individual insurance schemes.<br />
The number gradually increased until 2010 and then<br />
decreased slightly in 2011 170 . This was, in fact, the first year<br />
that supplementary pensions were paid. However, due<br />
to low 171 insurance premiums, which have a tendency to<br />
decrease in value, a low yield on the funds saved and, as<br />
a result, low pension annuities, and owing to continued<br />
uncertainties in financial markets, most insured persons,<br />
instead of opting for a pension annuity, decide for a oneoff<br />
withdrawal of the funds saved despite the income tax<br />
provision which imposed a considerably higher tax on<br />
such withdrawals.<br />
Box 7: Factors of public health care expenditure growth in the EU and Slovenia<br />
The impact of non-demographic drivers on the growth of public health care expenditure in Slovenia is on average<br />
considerably smaller than in the EU. According to the econometric study produced by the European Commission<br />
(Alternative Scenarios for Assessing the Impact of Non-Demographic Factors on Health Care Expenditure, 2011),<br />
population ageing (change in the demographic structure) in the EU Member States contributed in the period 1960–2009<br />
to the growth of the public health care expenditure on average only 10%, the increase in GDP per capita slightly more<br />
than 60%, while the remaining solid 25% were contributed by the effects of other, non-demographic factors such as the<br />
introduction of new (costly) technologies, the institutional characteristics of health-care systems (e.g. increased number<br />
of people covered by compulsory health insurance), employment and wage growth in the health care system, Baumol<br />
effect on the increase in relative prices 1 and other factors on the supply side. During the period 1995–2008, Slovenia’s<br />
public health care expenditure per capita grew in real terms on average by 4.4% annually, whereby population ageing<br />
contributed 0.8 p.p. and the GDP growth per capita 4.2 p.p., whereas the contribution of non-demographic factors was<br />
negative (-0.6 p.p.). In EU Member States, the contribution of non-demographic factors was +0.8 p.p. on average; the<br />
only country alongside Slovenia that featured a negative effect was Hungary. The coefficient of income elasticity of<br />
public health care expenditure for EU Member States in the aforementioned period thus on average amounted to no less<br />
that 1.3–1.5, while, for Slovenia, this coefficient was only 0.8–1.0. A negative contribution of non-demographic factors<br />
in Slovenia can be partly attributed to effective control of the growth of public expenditure for health care (especially<br />
the increase in wages and the prices of medical products). However, this can also be a result of a slow introduction of<br />
new technologies, poorer facilities, and insufficient number of doctors in the public health care system, a circumstance<br />
which has an impact on the health status of the population. According to life expectancy indicators, Slovenia still lags<br />
behind the EU average, while the healthy life years indicator shows that we are catching up with the EU average 2 (basic<br />
indicators of the population’s health status that also positively correlate with health care expenditures). The OECD<br />
points out (Health Care Systems: Efficiency and Policy Settings, 2010) that life expectancy could be raised by more than<br />
two years on average, holding health care spending constant and improving the performance of health systems, while<br />
further improvement in the population’s health condition would require increased investments in health care.<br />
1<br />
In health care, like in other labour intensive sectors, new technologies do not reduce the quantity of work required, but increase costs. In respect of<br />
other activities, the labour productivity therefore relatively declines with the result that prices in health care grow faster compared to the level of general<br />
price growth.<br />
2<br />
See Life Expectancy and Healthy Life Years indicator.<br />
169<br />
The data provided by the Ministry of Labour, Family and Social Affairs (MLFSA) refer to September 2011.<br />
170<br />
According to the data of the Ministry of Labour, Family and Social Affairs there were 536,922 people insured under the supplementary<br />
pension scheme in September 2011, while in December 2010 this scheme included 541,464 persons.<br />
171<br />
According to the MLFSA data for September 2011, their average monthly amount was between EUR 30 and 40 per insured person.<br />
172<br />
Measured by SHA methodology (System of Health Accounts).


