

development report 2012 - UMAR
development report 2012 - UMAR
development report 2012 - UMAR

You also want an ePaper? Increase the reach of your titles
YUMPU automatically turns print PDFs into web optimized ePapers that Google loves.
Development Report <strong>2012</strong><br />
Development by the priorities of SDS – A competitive economy and faster economic growth<br />
23<br />
Box 2: Excessive Imbalance Procedure at EU level<br />
In autumn 2011, the European Commission put in place a mechanism in order to provide an early warning system<br />
against excessive imbalances in EU Member States and to take action against such imbalances. In times of economic<br />
crisis, numerous EU Member States are faced with deterioration in competitiveness and various macroeconomic<br />
imbalances. With a view to detecting such imbalances in the early stages, the European Commission prepared a new<br />
mechanism called the Excessive Imbalance Procedure. This mechanism relies on three main elements: (i) an early<br />
warning system alerting to potential imbalances, (ii) preventive and corrective action; and (iii) the enforcement of<br />
sanctions. The early warning system is based on several indicators used for the assessment of potential imbalances<br />
(macroeconomic imbalance procedure scoreboard). In cases of minor imbalances, the Commission issues preventive<br />
recommendations to the Member States, while in serious cases the country concerned has to prepare a corrective<br />
action plan. In the event that a country fails to respond adequately, it may ultimately be imposed financial sanctions<br />
reaching up to 0.1% of GDP. The excessive imbalance procedure will start to apply in <strong>2012</strong> within the framework of the<br />
European semester, expected to strengthen the economic governance by way of ex ante coordination of budgetary<br />
and economic policies at EU level.<br />
In order to provide for the early detection of potential imbalances, the Commission has currently defined 10<br />
indicators as the most suitable for detecting macroeconomic imbalances or gaps in competitiveness. They are divided<br />
into two groups: external imbalance indicators (current account balance, net international investment position, export<br />
market shares, nominal unit labour costs and real effective exchange rate), and internal imbalance indicators (house prices,<br />
private sector debt, private sector credit flow, public sector debt and the unemployment rate). Alert thresholds have been<br />
set for each indicator where breaching the threshold means that the country concerned has an imbalance in a certain<br />
area which may be problematic. Indicator results show the first warning; the next step consists of an in-depth analysis<br />
to determine whether the imbalance identified is truly problematic. To this end, the European Commission foresaw<br />
additional indicators to be used in the economic reading of the macroeconomic imbalances procedure scoreboard.<br />
As a rule, country-specific circumstances should also be taken into consideration. Although the early warning system<br />
includes fiscal indicators, the excessive imbalance procedure has not been envisaged for the purposes of assessing<br />
fiscal sustainability, since this is to be assessed within the framework of the Stability and Growth Pact.<br />
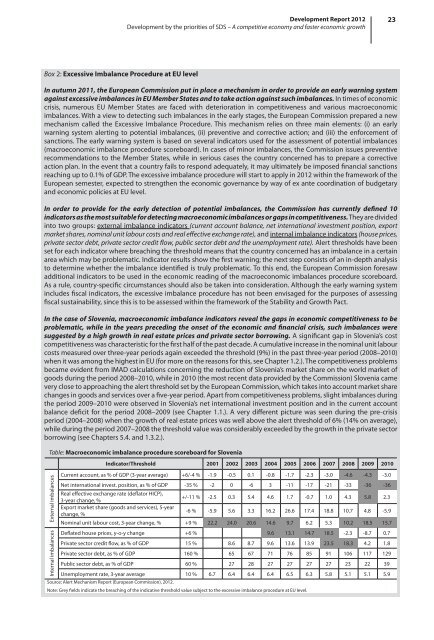
In the case of Slovenia, macroeconomic imbalance indicators reveal the gaps in economic competitiveness to be<br />
problematic, while in the years preceding the onset of the economic and financial crisis, such imbalances were<br />
suggested by a high growth in real estate prices and private sector borrowing. A significant gap in Slovenia’s cost<br />
competitiveness was characteristic for the first half of the past decade. A cumulative increase in the nominal unit labour<br />
costs measured over three-year periods again exceeded the threshold (9%) in the past three-year period (2008–2010)<br />
when it was among the highest in EU (for more on the reasons for this, see Chapter 1.2.). The competitiveness problems<br />
became evident from IMAD calculations concerning the reduction of Slovenia’s market share on the world market of<br />
goods during the period 2008–2010, while in 2010 (the most recent data provided by the Commission) Slovenia came<br />
very close to approaching the alert threshold set by the European Commission, which takes into account market share<br />
changes in goods and services over a five-year period. Apart from competitiveness problems, slight imbalances during<br />
the period 2009–2010 were observed in Slovenia’s net international investment position and in the current account<br />
balance deficit for the period 2008–2009 (see Chapter 1.1.). A very different picture was seen during the pre-crisis<br />
period (2004–2008) when the growth of real estate prices was well above the alert threshold of 6% (14% on average),<br />
while during the period 2007–2008 the threshold value was considerably exceeded by the growth in the private sector<br />
borrowing (see Chapters 5.4. and 1.3.2.).<br />
Table: Macroeconomic imbalance procedure scoreboard for Slovenia<br />
Indicator/Threshold 2001 2002 2003 2004 2005 2006 2007 2008 2009 2010<br />
External imbalances<br />
Internal imbalances<br />
Current account, as % of GDP (3-year average) +6/-4 % -1.9 -0.5 0.1 -0.8 -1.7 -2.3 -3.0 -4.6 -4.3 -3.0<br />
Net international invest. position, as % of GDP -35 % -2 0 -6 3 -11 -17 -21 -33 -36 -36<br />
Real effective exchange rate (deflator HICP),<br />
3-year change, %<br />
+/-11 % -2.5 0.3 5.4 4.6 1.7 -0.7 1.0 4.3 5.8 2.3<br />
Export market share (goods and services), 5-year<br />
change, %<br />
-6 % -5.9 5.6 3.3 16.2 26.6 17.4 18.8 10.7 4.8 -5.9<br />
Nominal unit labour cost, 3-year change, % +9 % 22.2 24.0 20.6 14.6 9.7 6.2 5.3 10.2 18.5 15.7<br />
Deflated house prices, y-o-y change +6 % 9.6 13.1 14.7 18.5 -2.3 -8.7 0.7<br />
Private sector credit flow, as % of GDP 15 % 8.6 8.7 9.6 13.6 13.9 23.5 18.3 4.2 1.8<br />
Private sector debt, as % of GDP 160 % 65 67 71 76 85 91 106 117 129<br />
Public sector debt, as % of GDP 60 % 27 28 27 27 27 27 23 22 39<br />
Unemployment rate, 3-year average 10 % 6.7 6.4 6.4 6.4 6.5 6.3 5.8 5.1 5.1 5.9<br />
Source: Alert Mechanism Report (European Commission), <strong>2012</strong>.<br />
Note: Grey fields indicate the breaching of the indicative threshold value subject to the excessive imbalance procedure at EU level.


