

development report 2012 - UMAR
development report 2012 - UMAR
development report 2012 - UMAR

Create successful ePaper yourself
Turn your PDF publications into a flip-book with our unique Google optimized e-Paper software.
Development Report <strong>2012</strong><br />
Development by the priorities of SDS – An efficient and less costly state<br />
49<br />
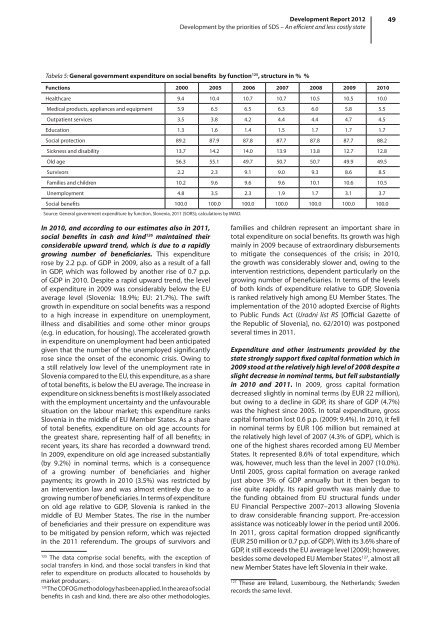
Tabela 5: General government expenditure on social benefits by function 125 , structure in % %<br />
Functions 2000 2005 2006 2007 2008 2009 2010<br />
Healthcare 9.4 10.4 10.7 10.7 10.5 10.5 10.0<br />
Medical products, appliances and equipment 5.9 6.5 6.5 6.3 6.0 5.8 5.5<br />
Outpatient services 3.5 3.8 4.2 4.4 4.4 4.7 4.5<br />
Education 1.3 1.6 1.4 1.5 1.7 1.7 1.7<br />
Social protection 89.2 87.9 87.8 87.7 87.8 87.7 88.2<br />
Sickness and disability 13.7 14.2 14.0 13.9 13.8 12.7 12.8<br />
Old age 56.3 55.1 49.7 50.7 50.7 49.9 49.5<br />
Survivors 2.2 2.3 9.1 9.0 9.3 8.6 8.5<br />
Families and children 10.2 9.6 9.6 9.6 10.1 10.6 10.5<br />
Unemployment 4.8 3.5 2.3 1.9 1.7 3.1 3.7<br />
Social benefits 100.0 100.0 100.0 100.0 100.0 100.0 100.0<br />
Source: General government expenditure by function, Slovenia, 2011 (SORS); calculations by IMAD.<br />
In 2010, and according to our estimates also in 2011,<br />
social benefits in cash and kind 126 maintained their<br />
considerable upward trend, which is due to a rapidly<br />
growing number of beneficiaries. This expenditure<br />
rose by 2.2 p.p. of GDP in 2009, also as a result of a fall<br />
in GDP, which was followed by another rise of 0.7 p.p.<br />
of GDP in 2010. Despite a rapid upward trend, the level<br />
of expenditure in 2009 was considerably below the EU<br />
average level (Slovenia: 18.9%; EU: 21.7%). The swift<br />
growth in expenditure on social benefits was a respond<br />
to a high increase in expenditure on unemployment,<br />
illness and disabilities and some other minor groups<br />
(e.g. in education, for housing). The accelerated growth<br />
in expenditure on unemployment had been anticipated<br />
given that the number of the unemployed significantly<br />
rose since the onset of the economic crisis. Owing to<br />
a still relatively low level of the unemployment rate in<br />
Slovenia compared to the EU, this expenditure, as a share<br />
of total benefits, is below the EU average. The increase in<br />
expenditure on sickness benefits is most likely associated<br />
with the employment uncertainty and the unfavourable<br />
situation on the labour market; this expenditure ranks<br />
Slovenia in the middle of EU Member States. As a share<br />
of total benefits, expenditure on old age accounts for<br />
the greatest share, representing half of all benefits; in<br />
recent years, its share has recorded a downward trend.<br />
In 2009, expenditure on old age increased substantially<br />
(by 9.2%) in nominal terms, which is a consequence<br />
of a growing number of beneficiaries and higher<br />
payments; its growth in 2010 (3.5%) was restricted by<br />
an intervention law and was almost entirely due to a<br />
growing number of beneficiaries. In terms of expenditure<br />
on old age relative to GDP, Slovenia is ranked in the<br />
middle of EU Member States. The rise in the number<br />
of beneficiaries and their pressure on expenditure was<br />
to be mitigated by pension reform, which was rejected<br />
in the 2011 referendum. The groups of survivors and<br />
125<br />
The data comprise social benefits, with the exception of<br />
social transfers in kind, and those social transfers in kind that<br />
refer to expenditure on products allocated to households by<br />
market producers.<br />
126<br />
The COFOG methodology has been applied. In the area of social<br />
benefits in cash and kind, there are also other methodologies.<br />
families and children represent an important share in<br />
total expenditure on social benefits. Its growth was high<br />
mainly in 2009 because of extraordinary disbursements<br />
to mitigate the consequences of the crisis; in 2010,<br />
the growth was considerably slower and, owing to the<br />
intervention restrictions, dependent particularly on the<br />
growing number of beneficiaries. In terms of the levels<br />
of both kinds of expenditure relative to GDP, Slovenia<br />
is ranked relatively high among EU Member States. The<br />
implementation of the 2010 adopted Exercise of Rights<br />
to Public Funds Act (Uradni list RS [Official Gazette of<br />
the Republic of Slovenia], no. 62/2010) was postponed<br />
several times in 2011.<br />
Expenditure and other instruments provided by the<br />
state strongly support fixed capital formation which in<br />
2009 stood at the relatively high level of 2008 despite a<br />
slight decrease in nominal terms, but fell substantially<br />
in 2010 and 2011. In 2009, gross capital formation<br />
decreased slightly in nominal terms (by EUR 22 million),<br />
but owing to a decline in GDP, its share of GDP (4.7%)<br />
was the highest since 2005. In total expenditure, gross<br />
capital formation lost 0.6 p.p. (2009: 9.4%). In 2010, it fell<br />
in nominal terms by EUR 106 million but remained at<br />
the relatively high level of 2007 (4.3% of GDP), which is<br />
one of the highest shares recorded among EU Member<br />
States. It represented 8.6% of total expenditure, which<br />
was, however, much less than the level in 2007 (10.0%).<br />
Until 2005, gross capital formation on average ranked<br />
just above 3% of GDP annually but it then began to<br />
rise quite rapidly. Its rapid growth was mainly due to<br />
the funding obtained from EU structural funds under<br />
EU Financial Perspective 2007–2013 allowing Slovenia<br />
to draw considerable financing support. Pre-accession<br />
assistance was noticeably lower in the period until 2006.<br />
In 2011, gross capital formation dropped significantly<br />
(EUR 250 million or 0.7 p.p. of GDP). With its 3.6% share of<br />
GDP, it still exceeds the EU average level (2009); however,<br />
besides some developed EU Member States 127 , almost all<br />
new Member States have left Slovenia in their wake.<br />
127<br />
These are Ireland, Luxembourg, the Netherlands; Sweden<br />
records the same level.


