

development report 2012 - UMAR
development report 2012 - UMAR
development report 2012 - UMAR

You also want an ePaper? Increase the reach of your titles
YUMPU automatically turns print PDFs into web optimized ePapers that Google loves.
Development Report <strong>2012</strong><br />
Development by the priorities of SDS – A competitive economy and faster economic growth<br />
25<br />
1.2. Increasing competitiveness<br />
and promoting entrepreneurial<br />
<strong>development</strong><br />
The Slovenian economy’s export competitiveness<br />
has deteriorated considerably since the onset of the<br />
economic crisis (2008). During the period between<br />
the beginning of 2008 and the third quarter of 2011,<br />
Slovenia lost approximately 15.6% of its export market<br />
share on the world market of goods and 7.5% in its<br />
largest trading partners 20 . This loss accounted for a good<br />
half of the increases made during the preceding sevenyear<br />
period of incessant growth 21 . The contraction of<br />
export market shares at the beginning of the crisis was<br />
characteristic of all EU Member States. However, Slovenia<br />
was ranked in the group of countries with the largest<br />
contraction on the world market 22 . During the period<br />
2008–2009, a drop in market shares was alleviated by the<br />
incentives for purchasing motor vehicles proposed by<br />
some EU Member States, which resulted in an increase<br />
in Slovenian exports and, consequently, an increase in<br />
the market share of motor vehicles on foreign markets<br />
(mainly in France and Germany). In 2010, when incentives<br />
for purchasing motor vehicles in the majority of its<br />
trading partners came to an end 23 , the drop in Slovenia’s<br />
foreign market share grew deeper (‐10%). That year,<br />
Slovenia came close to approaching the threshold of the<br />
excessive imbalances detection mechanism at EU level,<br />
which concerning the market share indicator, in addition<br />
to goods, includes also services 24 . Apart from motor<br />
vehicles, the reduction of shares on the foreign markets<br />
in 2010, as was the case in 2008–2009, also existed<br />
with the majority of other important Slovenian export<br />
product groups 25 . The data available for the first nine<br />
months of 2011 point to a stagnation in market shares<br />
on the world market and to slight growth recorded with<br />
its key trading partners. What is encouraging, however,<br />
is the high growth recorded in two of its most important<br />
trading partners: Germany and Croatia.<br />
20<br />
These comprise thirteen countries: Germany, Italy, Austria,<br />
France, United Kingdom, Poland, Hungary, Czech Republic,<br />
Croatia, Bosnia and Herzegovina, Russia, the United States and<br />
Macedonia.<br />
21<br />
The loss in its largest trade partners accounted for a quarter of<br />
the increase for the period 2000–2007.<br />
22<br />
During the period 2008–2009, a drop in its export market<br />
share meant Slovenia ranked eighth among 17 EU Member<br />
States; in 2010, a deterioration in its export competitiveness<br />
meant Slovenia ranked fourth among EU Member States. .<br />
23<br />
In France, incentives for purchasing motor vehicles gradually<br />
stopped (through reducing financial compensation) by the end<br />
of 2010. Some larger Member States, although less important<br />
importers of motor vehicles from Slovenia, offered these<br />
incentives throughout the whole year (the Netherlands) or part<br />
of 2010 (United Kingdom, Spain).<br />
24<br />
For more details, see Box 2: Excessive Imbalance Procedure<br />
at EU level.<br />
25<br />
See indicator Market share.<br />
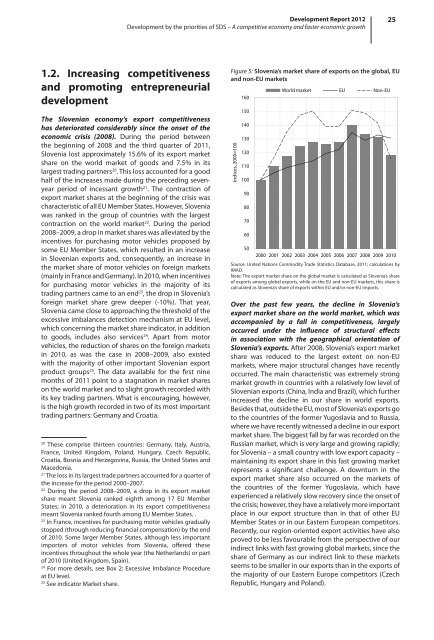
Figure 5: Slovenia’s market share of exports on the global, EU<br />
and non-EU markets<br />
Indices, 2000=100<br />
160<br />
150<br />
140<br />
130<br />
120<br />
110<br />
100<br />
90<br />
80<br />
70<br />
60<br />
World market EU Non-EU<br />
50<br />
2000 2001 2002 2003 2004 2005 2006 2007 2008 2009 2010<br />
Source: United Nations Commodity Trade Statistics Database, 2011; calculations by<br />
IMAD.<br />
Note: The export market share on the global market is calculated as Slovenia’s share<br />
of exports among global exports, while on the EU and non-EU markets, this share is<br />
calculated as Slovenia’s share of exports within EU and/or non-EU imports.<br />
Over the past few years, the decline in Slovenia’s<br />
export market share on the world market, which was<br />
accompanied by a fall in competitiveness, largely<br />
occurred under the influence of structural effects<br />
in association with the geographical orientation of<br />
Slovenia’s exports. After 2008, Slovenia’s export market<br />
share was reduced to the largest extent on non-EU<br />
markets, where major structural changes have recently<br />
occurred. The main characteristic was extremely strong<br />
market growth in countries with a relatively low level of<br />
Slovenian exports (China, India and Brazil), which further<br />
increased the decline in our share in world exports.<br />
Besides that, outside the EU, most of Slovenia’s exports go<br />
to the countries of the former Yugoslavia and to Russia,<br />
where we have recently witnessed a decline in our export<br />
market share. The biggest fall by far was recorded on the<br />
Russian market, which is very large and growing rapidly;<br />
for Slovenia – a small country with low export capacity –<br />
maintaining its export share in this fast growing market<br />
represents a significant challenge. A downturn in the<br />
export market share also occurred on the markets of<br />
the countries of the former Yugoslavia, which have<br />
experienced a relatively slow recovery since the onset of<br />
the crisis; however, they have a relatively more important<br />
place in our export structure than in that of other EU<br />
Member States or in our Eastern European competitors.<br />
Recently, our region-oriented export activities have also<br />
proved to be less favourable from the perspective of our<br />
indirect links with fast growing global markets, since the<br />
share of Germany as our indirect link to these markets<br />
seems to be smaller in our exports than in the exports of<br />
the majority of our Eastern Europe competitors (Czech<br />
Republic, Hungary and Poland).


