

development report 2012 - UMAR
development report 2012 - UMAR
development report 2012 - UMAR

You also want an ePaper? Increase the reach of your titles
YUMPU automatically turns print PDFs into web optimized ePapers that Google loves.
80 Development Report <strong>2012</strong><br />
Development by the priorities of SDS – Integration of measures to achieve sustainable <strong>development</strong><br />
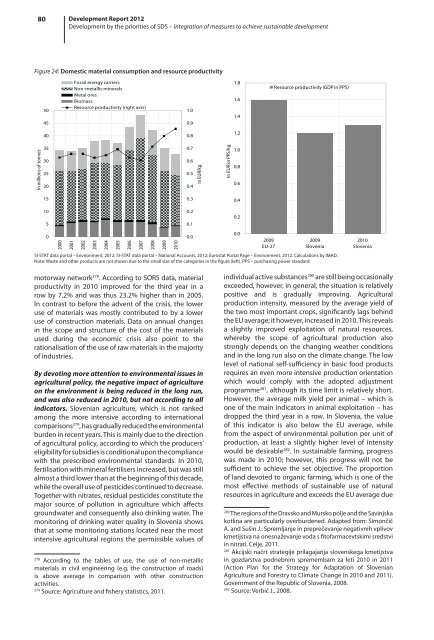
Figure 24: Domestic material consumption and resource productivity<br />
50<br />
45<br />
Fossil energy carriers<br />
Non-metallic minerals<br />
Metal ores<br />
Biomass<br />
Resource productivity (right axis)<br />
1.0<br />
0.9<br />
1.8<br />
1.6<br />
1.4<br />
Resource productivity (GDP in PPS)<br />
40<br />
0.8<br />
1.2<br />
In millions of tonnes<br />
35<br />
30<br />
25<br />
20<br />
0.7<br />
0.6<br />
0.5<br />
0.4<br />
In EUR/kg<br />
In EUR in PPS/kg<br />
1.0<br />
0.8<br />
0.6<br />
15<br />
0.3<br />
0.4<br />
10<br />
5<br />
0<br />
2000<br />
2001<br />
2002<br />
2003<br />
2004<br />
2005<br />
2006<br />
2007<br />
2008<br />
2009<br />
2010<br />
SI-STAT data portal – Environment, <strong>2012</strong>; SI-STAT data portal – National Accounts, <strong>2012</strong>; Eurostat Portal Page – Environment, <strong>2012</strong>. Calculations by IMAD.<br />
Note: Waste and other products are not shown due to the small size of the categories in the figure (left). PPS – purchasing power standard.<br />
0.2<br />
0.1<br />
0.0<br />
0.2<br />
0.0<br />
2009<br />
EU-27<br />
2009<br />
Slovenia<br />
2010<br />
Slovenia<br />
motorway network 278 . According to SORS data, material<br />
productivity in 2010 improved for the third year in a<br />
row by 7.2% and was thus 23.2% higher than in 2005.<br />
In contrast to before the advent of the crisis, the lower<br />
use of materials was mostly contributed to by a lower<br />
use of construction materials. Data on annual changes<br />
in the scope and structure of the cost of the materials<br />
used during the economic crisis also point to the<br />
rationalisation of the use of raw materials in the majority<br />
of industries.<br />
By devoting more attention to environmental issues in<br />
agricultural policy, the negative impact of agriculture<br />
on the environment is being reduced in the long run,<br />
and was also reduced in 2010, but not according to all<br />
indicators. Slovenian agriculture, which is not ranked<br />
among the more intensive according to international<br />
comparisons 279 , has gradually reduced the environmental<br />
burden in recent years. This is mainly due to the direction<br />
of agricultural policy, according to which the producers’<br />
eligibility for subsidies is conditional upon the compliance<br />
with the prescribed environmental standards. In 2010,<br />
fertilisation with mineral fertilisers increased, but was still<br />
almost a third lower than at the beginning of this decade,<br />
while the overall use of pesticides continued to decrease.<br />
Together with nitrates, residual pesticides constitute the<br />
major source of pollution in agriculture which affects<br />
groundwater and consequently also drinking water. The<br />
monitoring of drinking water quality in Slovenia shows<br />
that at some monitoring stations located near the most<br />
intensive agricultural regions the permissible values of<br />
278<br />
According to the tables of use, the use of non-metallic<br />
materials in civil engineering (e.g. the construction of roads)<br />
is above average in comparison with other construction<br />
activities.<br />
279<br />
Source: Agriculture and fishery statistics, 2011.<br />
individual active substances 280 are still being occasionally<br />
exceeded, however, in general, the situation is relatively<br />
positive and is gradually improving. Agricultural<br />
production intensity, measured by the average yield of<br />
the two most important crops, significantly lags behind<br />
the EU average; it however, increased in 2010. This reveals<br />
a slightly improved exploitation of natural resources,<br />
whereby the scope of agricultural production also<br />
strongly depends on the changing weather conditions<br />
and in the long run also on the climate change. The low<br />
level of national self-sufficiency in basic food products<br />
requires an even more intensive production orientation<br />
which would comply with the adopted adjustment<br />
programme 281 , although its time limit is relatively short.<br />
However, the average milk yield per animal – which is<br />
one of the main indicators in animal exploitation – has<br />
dropped the third year in a row. In Slovenia, the value<br />
of this indicator is also below the EU average, while<br />
from the aspect of environmental pollution per unit of<br />
production, at least a slightly higher level of intensity<br />
would be desirable 282 . In sustainable farming, progress<br />
was made in 2010; however, this progress will not be<br />
sufficient to achieve the set objective. The proportion<br />
of land devoted to organic farming, which is one of the<br />
most effective methods of sustainable use of natural<br />
resources in agriculture and exceeds the EU average due<br />
280<br />
The regions of the Dravsko and Mursko polje and the Savinjska<br />
kotlina are particularly overburdened. Adapted from: Simončič<br />
A. and Sušin J.: Spremljanje in preprečevanje negativnih vplivov<br />
kmetijstva na onesnaževanje voda s fitofarmacevtskimi sredstvi<br />
in nitrati. Celje, 2011.<br />
281<br />
Akcijski načrt strategije prilagajanja slovenskega kmetijstva<br />
in gozdarstva podnebnim spremembam za leti 2010 in 2011<br />
(Action Plan for the Strategy for Adaptation of Slovenian<br />
Agriculture and Forestry to Climate Change in 2010 and 2011).<br />
Government of the Republic of Slovenia, 2008.<br />
282<br />
Source: Verbič J., 2008.


